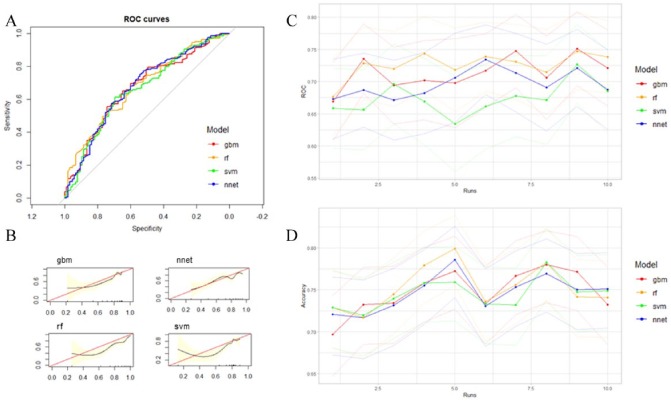
Figure 3.
(A) Area under ROC curve of all prediction models based on clinicopathological features and genomic clusters from gene expression data from one run. (B) Calibration slopes (CSs) of all models from one run. See Supplementary Figure 1 for CS graphs for all nine other runs. (C) ROC curve (with 95% CI in lighter colors) and (D) accuracy (with 95% CI in lighter colors) of all models for 10 random training/validation splits. All models performed similarly in terms of ROC and accuracy. Performance measures were stable over 10 random runs, with all methods predicting 5-year survival better than random. ROC indicates receiver operating characteristic.

