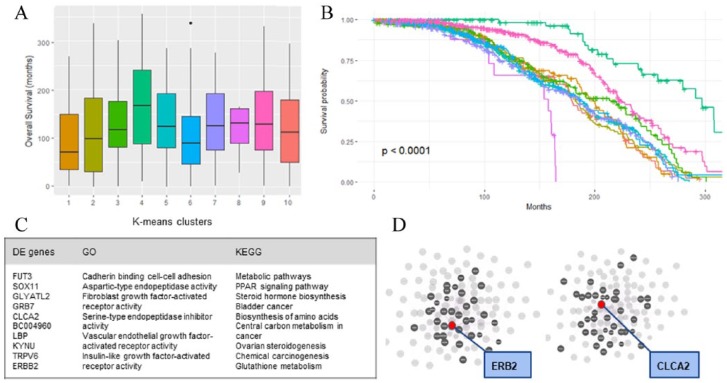
Figure 5.
Boxplot of overall survival distribution by genomic clusters for one run (A) and survival curve of the same genomic clusters derived from gene expression (B). There was a significant difference in survival between the clusters (P < .001). (C) Summary of the top 11 differentially expressed genes, top gene ontology terms, and top Kyoto encyclopedia of genes and genomes (KEGG) pathways found from differentially expressed genes. (D) Network hub of the top 100 differentially expressed genes for highlighting ERB2 hub (left) and CLCA2 hub (right). Red dot indicates ERB2 (left) and CLCA2 (right); grey dots indicate genes connected to red dots via functional pathways.

