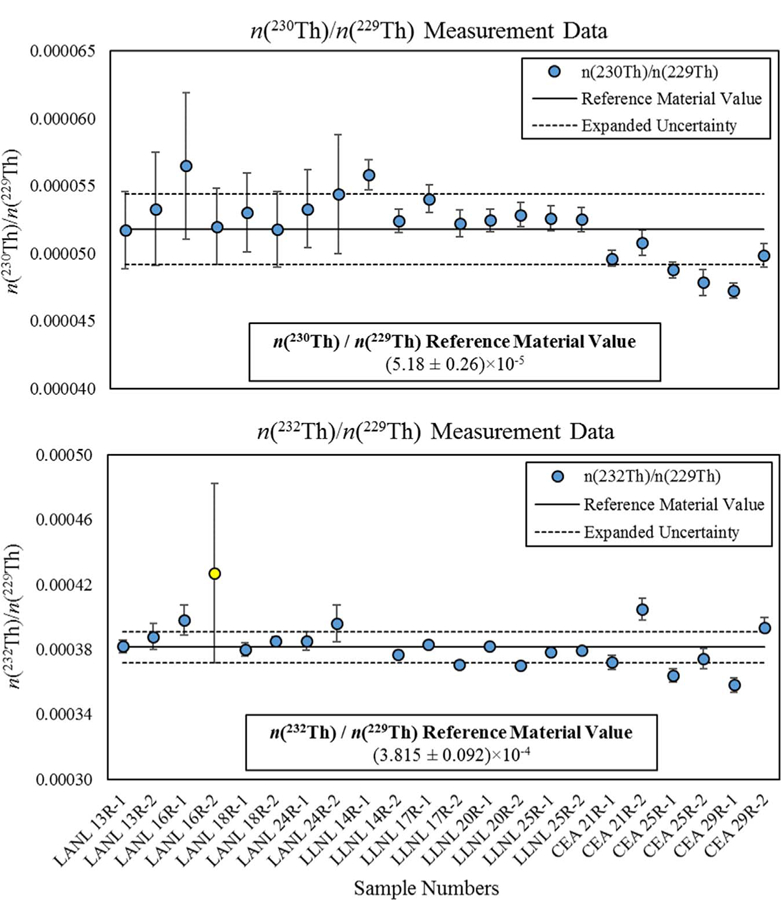
Fig. 1.

Thorium isotope amount ratio results for the 229Th reference material. Error bars are expanded uncertainties (U = k uc) for individual measurements as reported by the analysis laboratories. The solid lines are the reference material values based on weighted means of the mass spectrometry measurements. Dashed lines bracket the expanded uncertainty interval for the reference material values (k = 2). Data for n(232Th)/n(229Th) measurements of LANL 16R-2 (yellow symbol) and LLNL 14R-1 (outside of plot area) were identified as spurious analytical results by the mass spectrometry laboratories and were not incorporated into the weighed mean for the reference material value or statistical evaluations of the data. (For interpretation of the references to color in this figure legend, the reader is referred to the web version of this article.)
