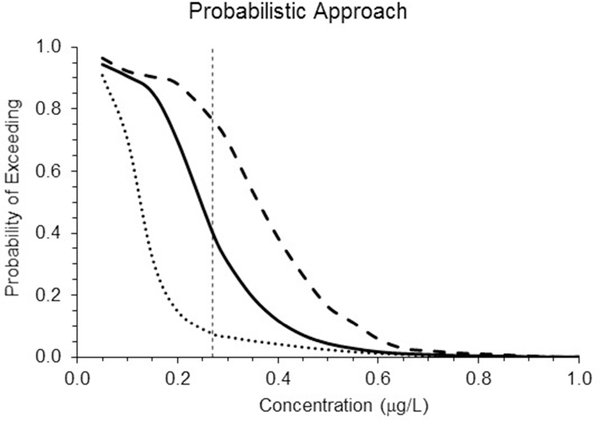
Figure 4.
Probability of exceeding a given concentration within the 21-d running averages of the exposure data. The center solid line is for the “original” time series, the lower dotted line for the “x0.5” data, and the upper dashed line for “x1.5”. The vertical dashed line is the NOAEC chronic value for mysids exposed to endosulfan (0.27 μg/L).

