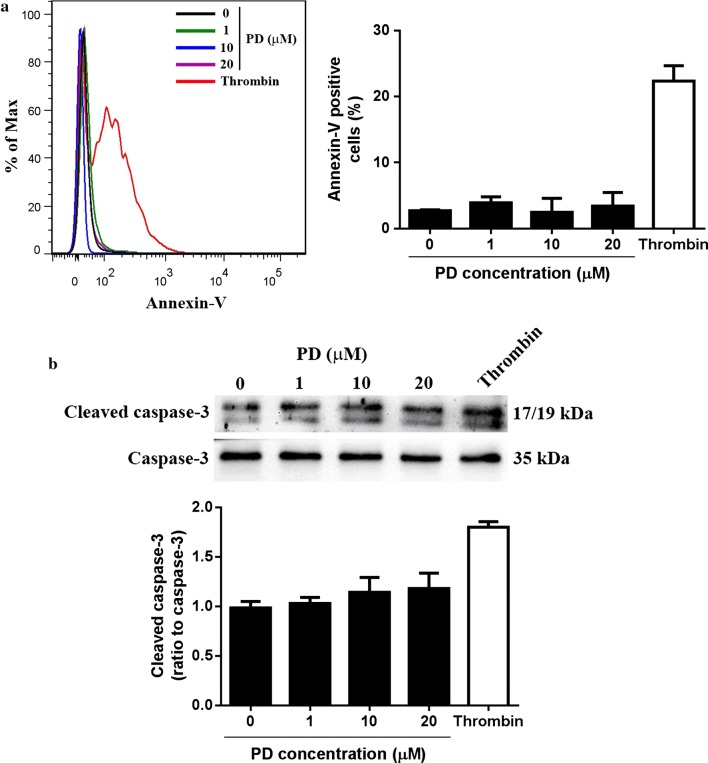
Fig. 6.
Analysis of platelet apoptosis after PD treatment. Washed platelets were treated with different doses of PD followed by measuring the surface expression of Annexin-V by flow cytometry (mean ± SD, n = 4) (a) and cleaved caspase-3 by western blot (mean ± SD, n = 4) (b). Thrombin (1 U/ml) stimulation was used as a positive control. Representative flow cytometry and western blot image was shown from four independent experiments

