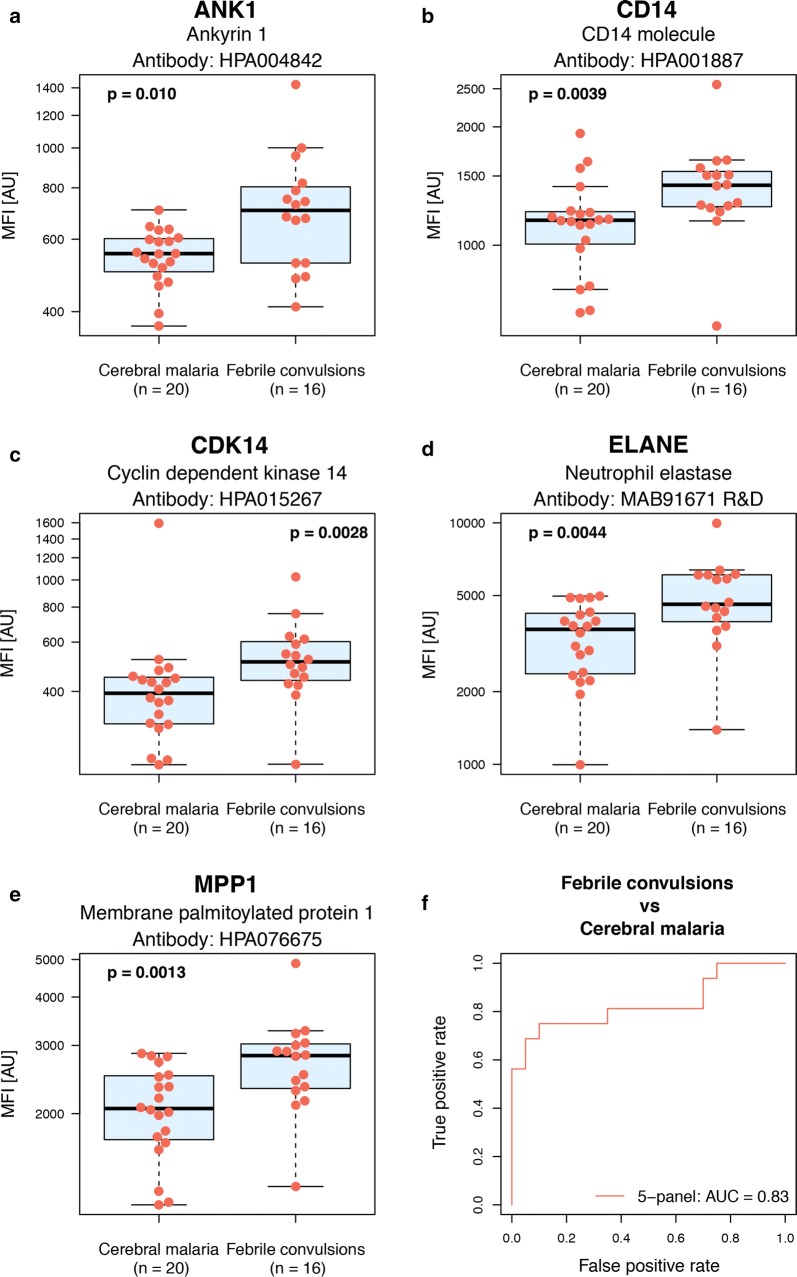
Fig. 7.
Boxplots outlining proteins with differential levels in cerebral malaria cases compared to febrile convulsion. Boxplots illustrating the relative intensities for the five proteins with differential protein levels in cerebral malaria compared to febrile convulsions during malaria infection (p-values < 0.01) together with a 5-protein multi-panel ROC curve. These boxplots include the relative intensity signal for each individual sample (the individual red dots). The ROC curve includes values for the area under the ROC curve (AUC) for the multi-protein panel. a Ankyrin 1 (ANK1). b Cyclin dependent kinase 14 (CDK14). c CD14 molecule (CD14). d Neutrophil elastase (ELANE). e Membrane palmitoylated protein 1 (MPP1). f 5-panel multi-protein signature of the five proteins

