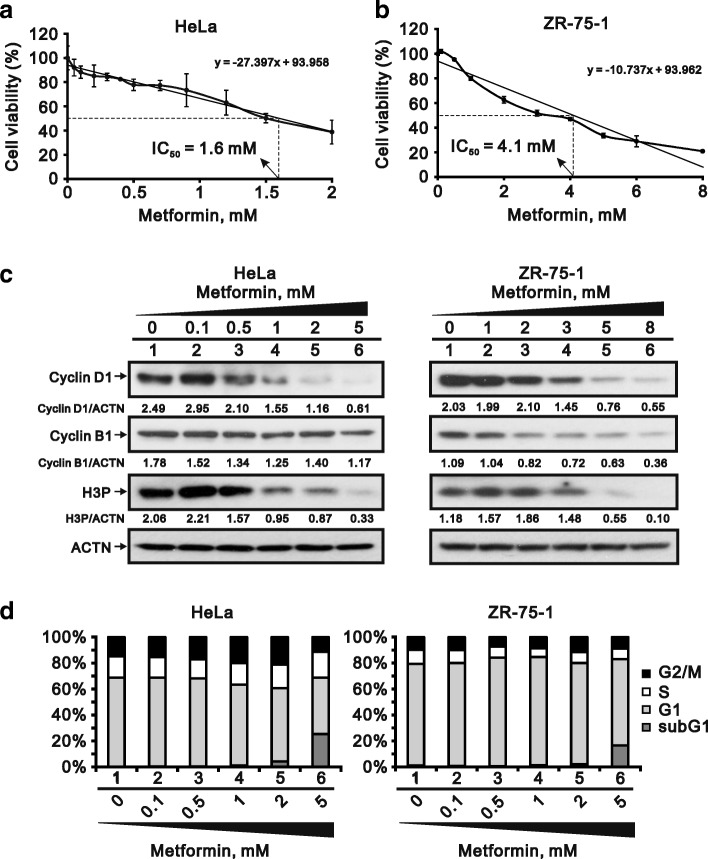
Fig. 1.
Cytotoxicity of metformin in HeLa and ZR-75-1 cells. a and b HeLa cells (a) and ZR-75-1 (b) cells were treated with the indicated concentration of metformin for 35 h and 70 h, respectively. Cell viability was measured using the MTT method. c HeLa and ZR-75-1 cells were incubated with indicated concentration of metformin for 20 h and 25 h, respectively. Cell lysates were subjected to western blot analysis using antibodies against cyclin D1, cyclin B1 and H3P. ACTN was the protein loading control. The protein levels of cyclin D1, cyclin B1 and H3P after normalization with the loading control protein ACTN are presented as fold change. d HeLa and ZR-75-1 cells were incubated with the indicated concentration of metformin for 30 h and 57 h, respectively. The cells were then subjected to flow cytometric cell cycle profile analysis. The results are representative of three independent experiments

