Fig. 2.
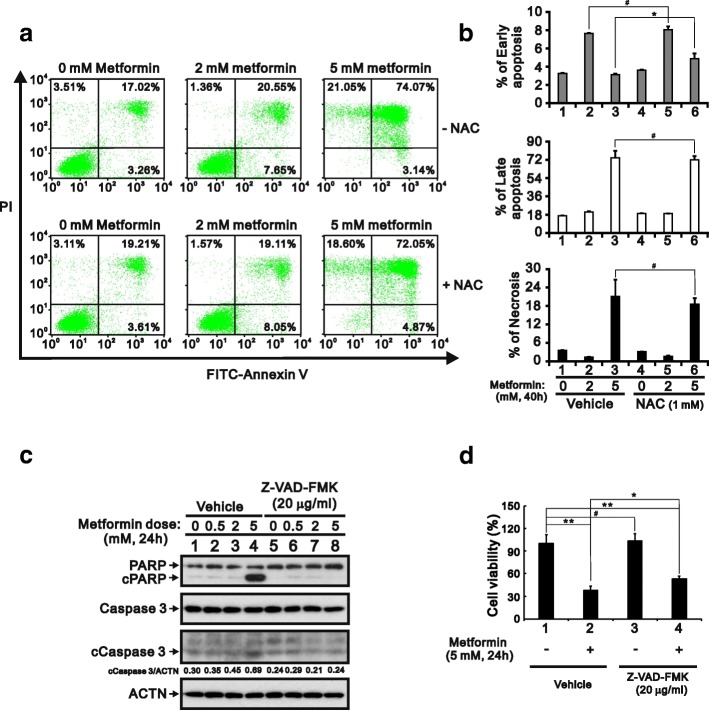
Metformin-induced apoptosis in HeLa cells. a HeLa cells (8 × 10⁴ cells) were incubated with the indicated concentration of metformin for 40 h, after which cell death, apoptosis or necrosis were quantified using FITC-Annexin V and PI and flow cytometry. b Quantitative analysis of percentage of indicated stages is presented as the mean ± S.D. of at least three independent experiments; # p > 0.05 and * p < 0.05 (Student’s t-test). c HeLa cells were incubated with the indicated concentration of metformin and 20 μg/ml Z-VAD-FMK for 24 h. Cell lysates were then subjected to western blotting with antibodies against PARP and caspase 3. ACTN was the loading control. The protein levels of cleaved Caspase 3 (cCaspase 3) after normalization with the loading control protein ACTN are presented as fold change. d HeLa cells (5 × 10⁴ cells) were treated with vehicle (DMSO), 5 mM metformin, 20 μg/ml Z-VAD-FMK, or 5 mM metformin plus 20 μg/ml Z-VAD-FMK for 24 h. Quantitative analysis of cell viability is presented as the mean ± S.D. of at least three independent experiments; # p > 0.05, * p < 0.05, and ** p < 0.01 (Student’s t-test)

