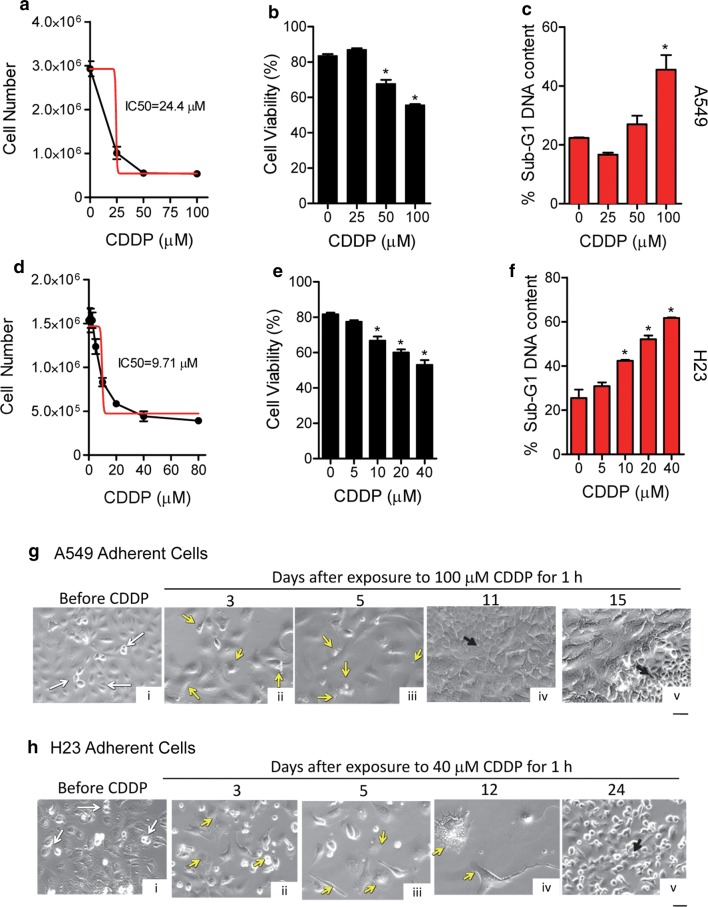
Fig. 1.
Sensitivity of NSCLC cells to CDDP and culture repopulation. A549 cells (a) or H23 cells (d) were seeded in six-well plates and given 2 days to attach before being treated with the indicated concentrations of CDDP for 1 h. Cells were then washed with PBS and provided untreated media. Five days later, cells were collected and counted using microcapillary cytometry (black line). The IC50 value was calculated using an algorithm from the GraphPad software (red line). Cell viability was assessed using the Guava ViaCount application (b, e), whereas hypodiploid DNA content was assessed by microcytometry upon propidium iodine binding (c, f). Phase contrast images were taken of adherent A549 (g) and H23 (h) cells, before and for various days after being exposed to CDDP for 1 h. White arrows indicate cells undergoing division. Yellow arrows depict signs of cellular damage. Black arrows depict clusters of cells undergoing active repopulation. Scale bar, 50 μm

