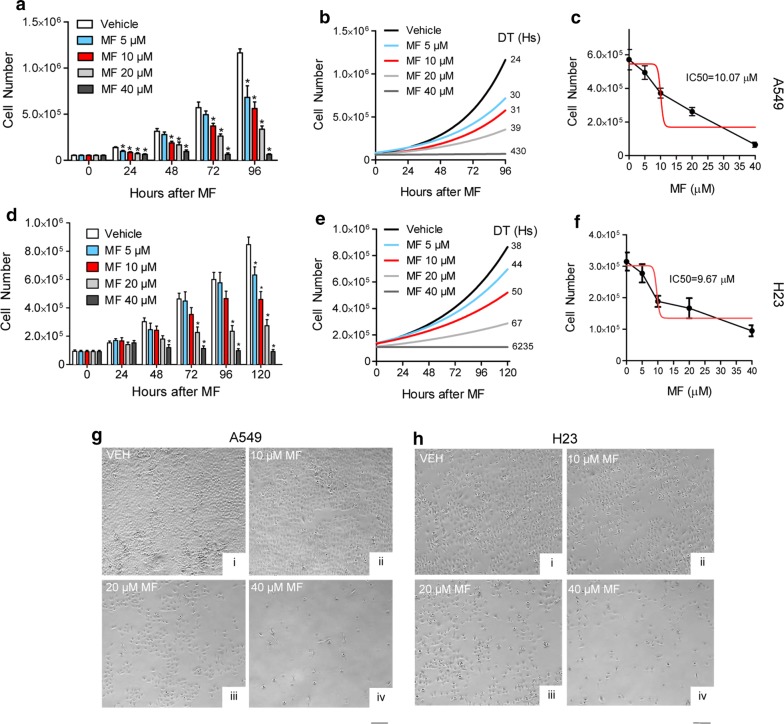
Fig. 2.
Effect of MF on the growth of NSCLC cells. A549 cells (a) or H23 cells (d) were seeded in six-well plates, treated with the indicated concentrations of MF, and counted at regular intervals. Results were analyzed using two-way ANOVA followed by Dunnett’s post hoc test. *Indicates p < 0.05 compared to vehicle at equivalent time point. In b and e, the doubling time (DT) for cells under each treatment regime was computed using a non-lineal exponential growth algorithm and is indicated next to each line. In c and f, A549 cells and H23 cells, respectively, were seeded and allowed to attach for 24 h before treatment with the indicated concentrations of MF. Following 72 h, cells were collected and counted using microcapillary cytometry (black line) and the IC50 calculated (red line). Panels g and h depict phase contrast microscopy images of the cultures following 3 days of MF treatment. Scale bar, 200 μm

