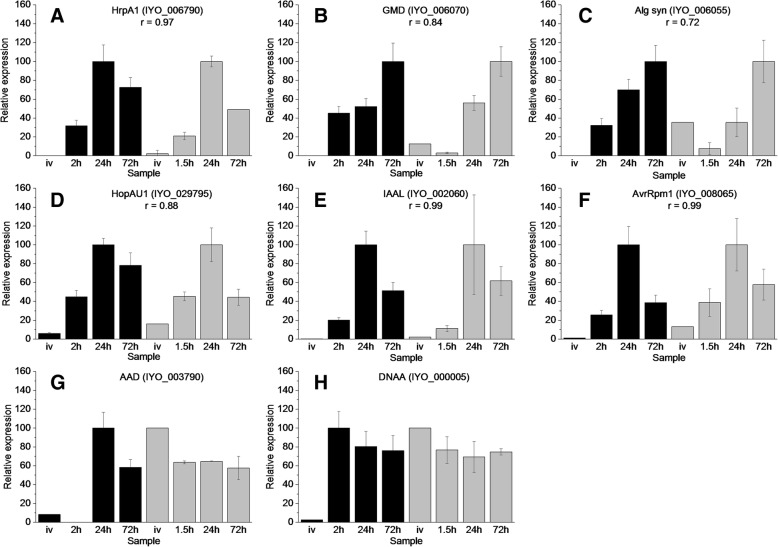
Fig. 7.
Reverse transcription quantitative PCR validation of RNA-seq data. Eight target genes and five potential reference genes were selected for reverse transcription quantitative PCR (RT-qPCR) (supplemental data set 13). RNA was extracted from Psa grown in vitro (IV) infected ‘Hort16A’ plantlets at 2, 24 and 72 h post infection (HPI). RT-qPCR values (three biological replicates) were based on normalisation against the geometric average/mean of three reference genes (IYO_010670, IYO_009010 and IYO_002170) selected using Bestkeeper and geNorm analysis [69, 70]. For comparison with the RNA-seq data, values were displayed by representing maximum expression of each gene as 100. Pearson correlation coefficients (r) > 0.5 between the RT-qPCR and RNA-seq data are displayed all primers are listed in supplemental data set 13. RT-qPCR data is represented by black bars and RNA-seq (reads per kb per million) by grey bars. a: HrpA1 (IYO_006790); b: GDP-mannose dehydrogenase (GMD, IYO_006070); c: Alginate synthase (IYO_006055); d: HopAU1 (IYO_029795); e: IAAL (IYO_002060); f: AvrRpm1 (IYO_008065); g: Amino acid adenylation protein (AAD, IYO_003790); h: DNAA (IYO_000005)

