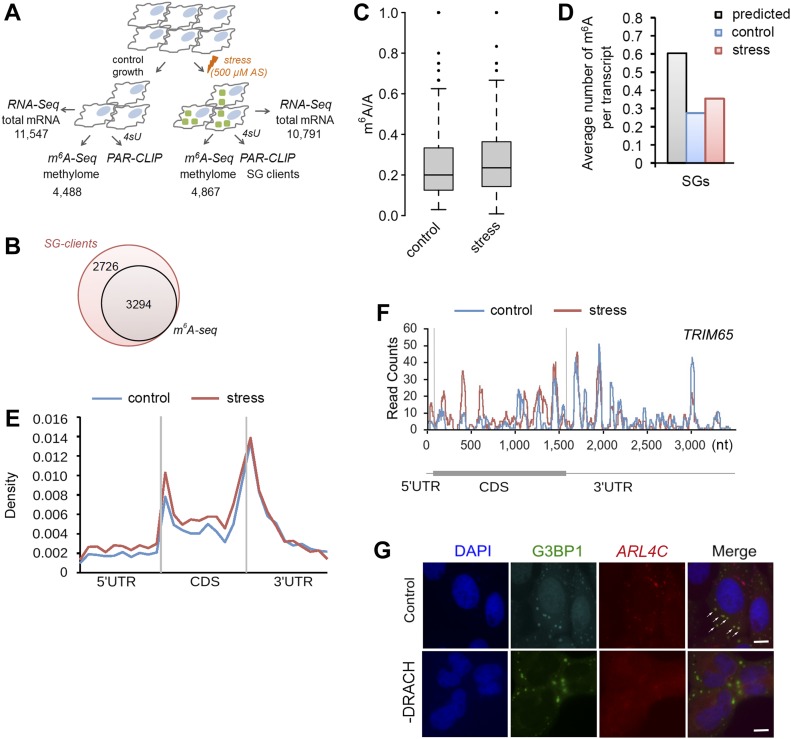
Figure 2. Site-specific methylation of SG mRNAs in response to oxidative stress.
(A) Overview of the experimental setup. Numbers denote confidently identified mRNAs in each deep-sequencing approach. (B) Overlap of the SG transcripts from the PAR-CLIP and m6A-Seq data sets. (C) Box-plot of m6A sites (from the m6A-Seq) detected across SG transcripts of untreated HEK-TIA1 cells (control) or exposed to stress (500 μM AS) and presented as a ratio of the total m6A sites (e.g., predicted DRACH motifs designated as A in the ratio m6A/A). P = 5.1 × 10⁻⁴ control versus stress, Mann–Whitney test. (D) Average number of m6A-modified DRACH motifs detected in the SG mRNAs following stress exposure to 500 μM AS (stress) compared with their methylation level under control growth. P = 1.49 × 10⁻⁵ control versus stress, Mann–Whitney test. For comparison, the average number of all putative DRACH motifs (predicted) per transcript is also included. (E) Metagene profiles of m6A distribution (from the m6A-Seq) along different transcript regions of SG mRNAs from untreated (control) or cells exposed to 500 μM AS (stress). P = 1.4 × 10⁻³ for 5′ UTRs and P = 1.6 × 10⁻² for 5′ vicinity of the CDSs; Mann–Whitney test between stress versus control. Transcript regions were binned for comparable lengths. (F) An example of stress-induced m6A modification in the SG transcript TRIM65. (G) Deletion of the methylation sites in the 5′ vicinity of ARL4C mRNA hinders its localization into SGs. U2OS-G3BP1 cells expressing ARL4C-CFP with unchanged sequence (control) or deleted DRACH motifs (-DRACH) exposed to 500 μM AS. The colocalization of the wild-type ARL4C-CFP mRNA with SGs is designated by white arrows. ARL4C-CFP mRNA was visualized by in situ hybridization (FISH). SGs (hyperfluorescent loci) were visualized through G3BP1–GFP (green), and nuclei were counterstained with DAPI (blue). 58 of 70 cells (83%) showed loss of colocalization by deleted DRACH motifs. Scale bar, 10 μm. Source data are available for this figure.

