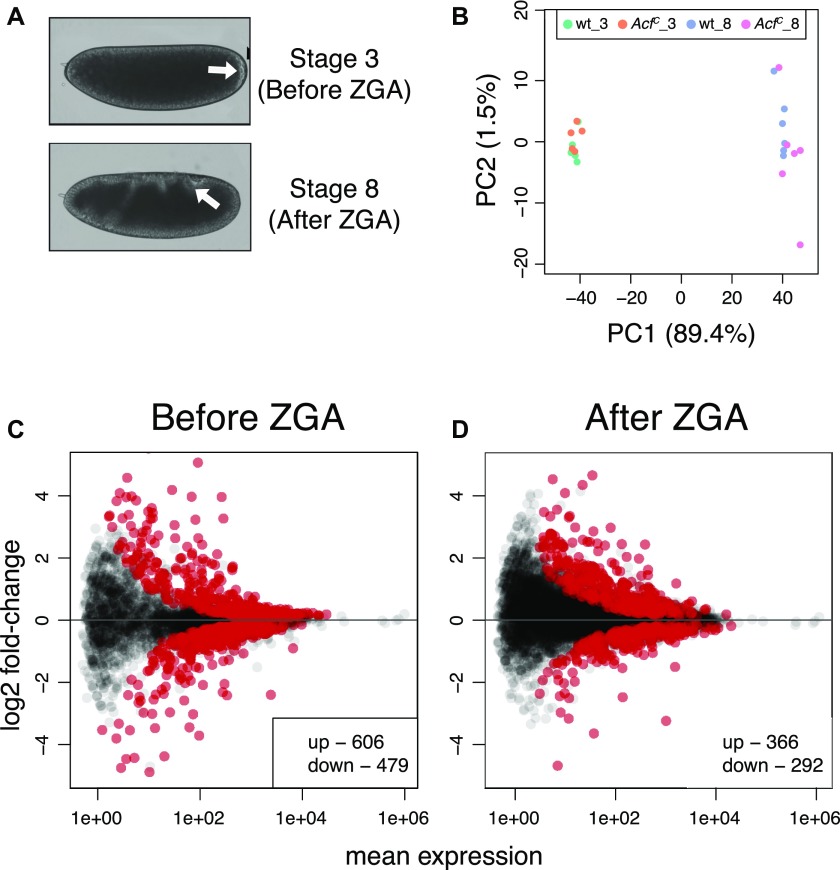
Figure 3. ACF1 loss perturbs gene expression in early embryos.
(A) Embryo stages selected for transcriptome analysis. In Bownes Stage 3, zygotic transcription is not established yet. Bownes Stage 8 shows robust zygotic transcription. Arrows highlight morphological features of the corresponding stages (appearance of pole cells in Stage 3 and germ band elongation in Stage 8). (B) PCA of single-embryo transcriptomes. Each dot represents a single replicate for the corresponding genotype/condition. _3 and _8 indicate embryos before and after ZGA, respectively. (C) Differential gene expression analysis of coding genes from RNA-seq data. Wild-type and AcfC transcriptomes were compared before ZGA (N = 7,585). Scatter plots represent log2 fold-change of AcfC over wild type for each gene in relation to its mean expression (mean of normalized counts). Red dots represent significant (q-value < 0.1) up- or down-regulated genes. (D). Same as (C) but after ZGA (N = 10,088).

