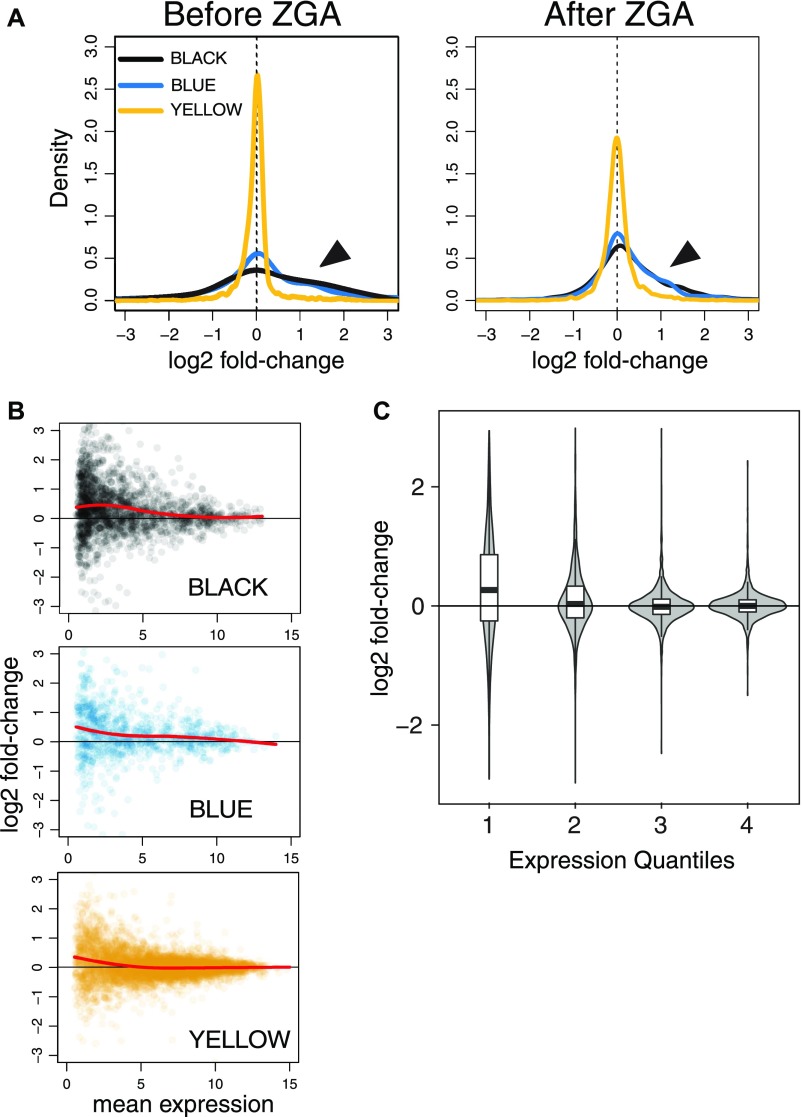
Figure 4. Loss of ACF1 affects transcription prominently in inactive chromatin.
(A) Comparison of wild-type and AcfC transcriptomes in relation to the five-state chromatin model. Plots represent the distribution of log2 fold-changes for genes belonging to the YELLOW, BLUE, and BLACK chromatin domains before and after ZGA. Arrows indicate the differences between BLACK/BLUE and YELLOW. (B) Each scatter plot represents log2 fold-change for each gene of the indicated chromatin state in relation to its mean expression (after ZGA only). Colors match the chromatin domains as described in the five-state model. Red lines represent local regression fit. (C) Violin plots represent log2 fold-change distributions for each given expression quartile (after ZGA only), regardless of the chromatin state. Boxplots are overlapped to show median values.

