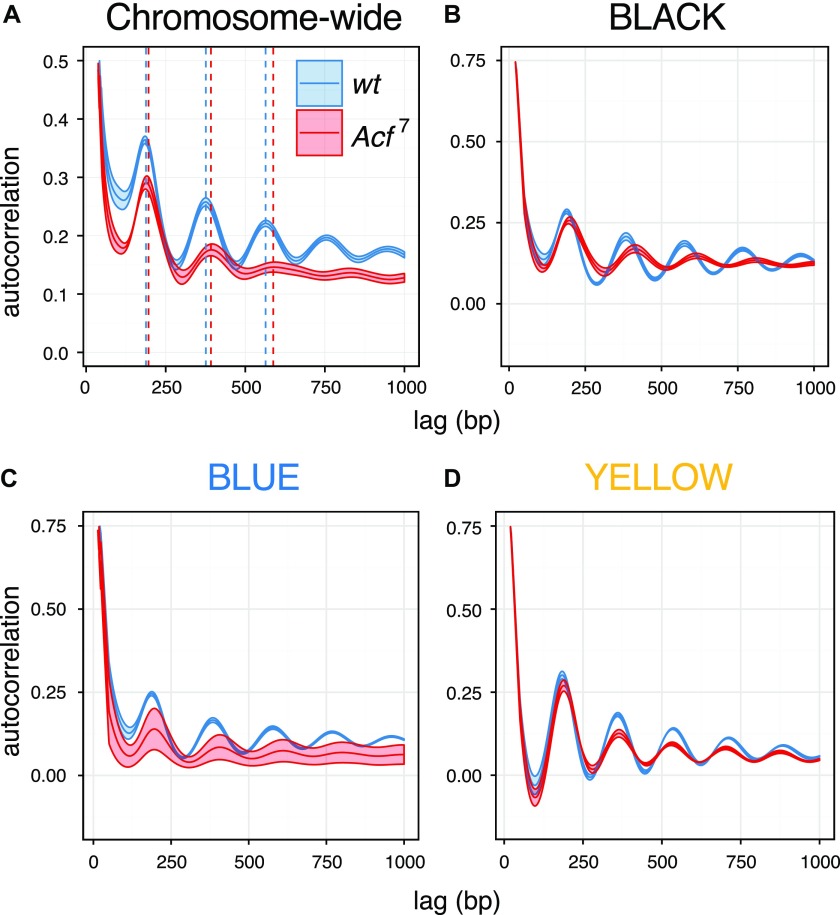
Figure 5. Global and context-dependent decrease in nucleosome regularity as a consequence of ACF1 loss.
(A) Changes in nucleosome periodicity on chromosomes 2 and 3 are estimated using the autocorrelation function. The correlation coefficients for the nucleosome occupancy values are plotted against the relative shifts (lag). The mean and SEM of replicate samples (n = 5 for wt and n = 3 for Acf7) are displayed. Dashed lines indicate the centers of nucleosome positions derived from the autocorrelation peaks. (B) Changes in nucleosome periodicity in BLACK chromatin domains estimated by the autocorrelation function. The mean and SEM of replicate samples are displayed. (C, D) Same as (B) but for BLUE and YELLOW chromatin domains, respectively.

