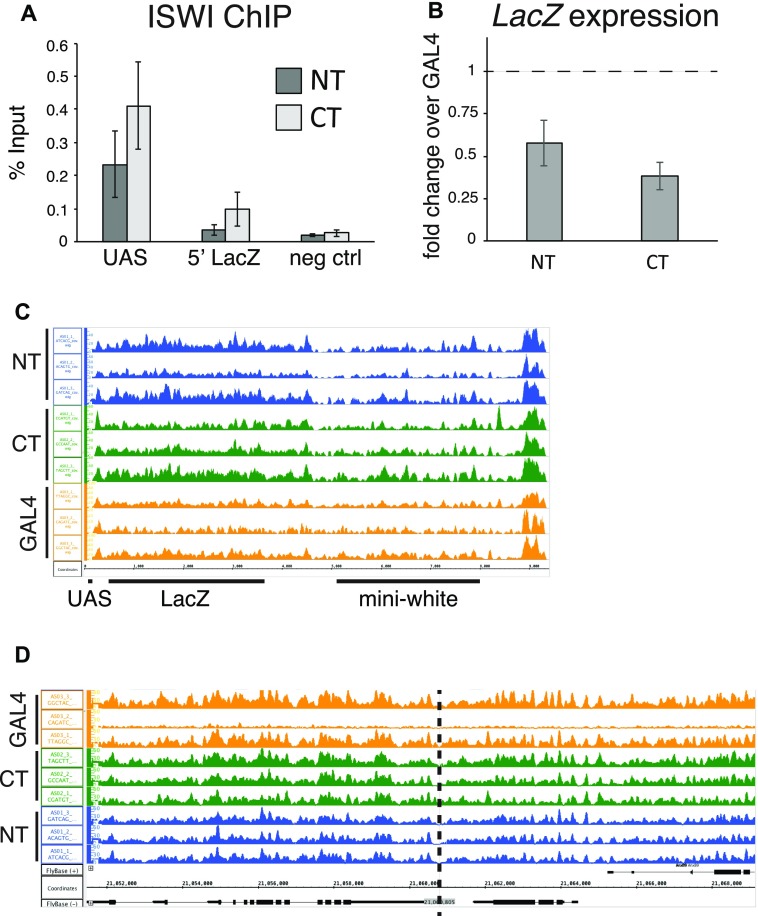
Figure S1.
(A) ChIP-qPCR to verify the recruitment of ISWI to the UAS sites. “UAS” and “5′ LacZ” denote the regions amplified by qPCR. Bars denote average % input enrichment (n = 3 biological replicates) ± SEM. “neg ctrl” represents a negative control locus (encompassing the Spt4 gene). (B) RT–qPCR assesses expression changes of the LacZ gene in early embryos (2–8 h) upon ACF1 tethering. Bars denote average fold-change over the control (GAL4DBD alone) (n = 3 biological replicates) ± SEM. (C) Screenshot of the genome browser representing the LacZ/mini-white reporter locus. Each track shows nucleosome dyad densities for each replicate of the corresponding genotype (as described in Fig 1A). (D) Same as (C) but depicting the genomic region surrounding the integration site of the LacZ reporter transgene (dashed line).

