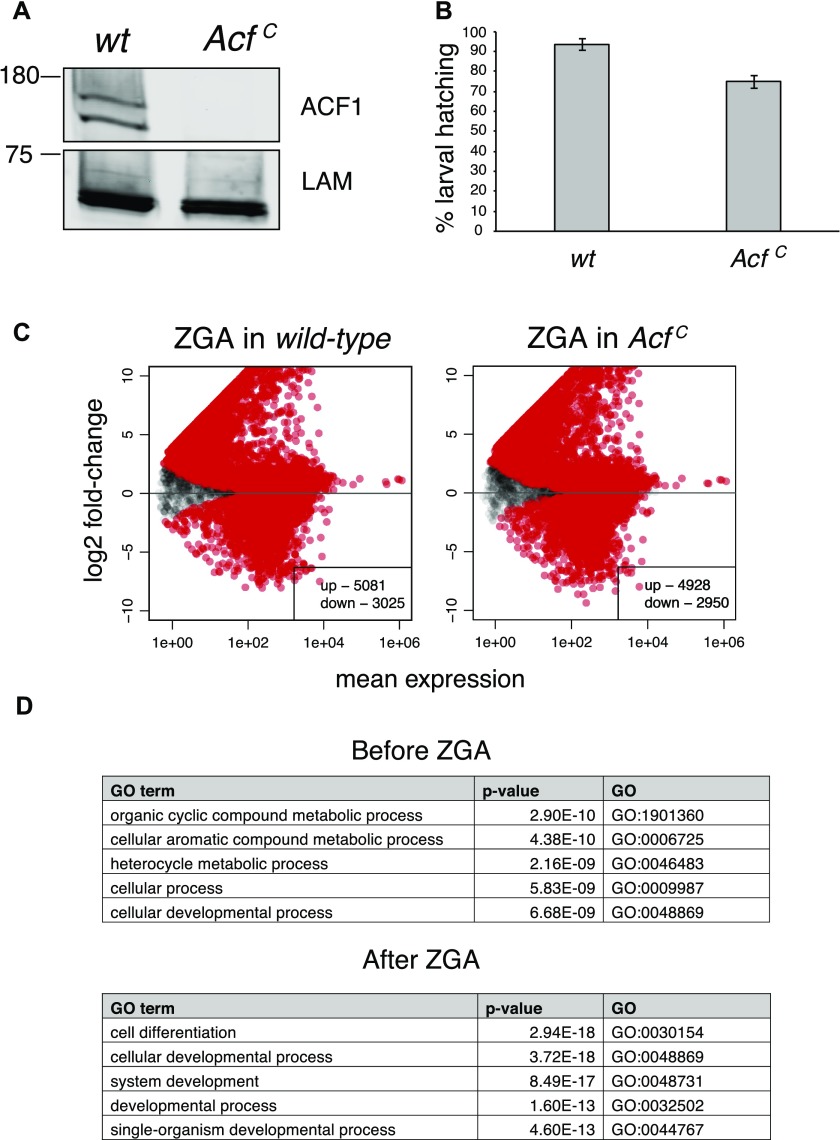
Figure S3.
(A) Western blot probing nuclear extract from wild-type (wt) and the newly generated ACF1 mutant (AcfC) embryos (0–16 h). No ACF1 was detected in mutant tissue using the antibody against ACF1. Lamin (LAM) serves as a loading control. (B) Comparison of larval hatching rate between wild-type (wt) and AcfC. Bars represent average % larval hatching (n = 3 biological replicates of N > 47 embryos each) ± SEM. (C) Differential gene expression analysis of coding genes from RNA-seq data. Wild-type (left panel) and AcfC (right panel) transcriptomes were separately analyzed to assess gene expression changes during maternal to zygotic transition. Scatter plots represent log2 fold-change for each gene between the two different developmental stages in relation to its mean expression (mean of normalized counts) (N = 9,235 for wild type, N = 9,163 for AcfC). Red dots represent statistically significant (q-value < 0.1) up- or down-regulated genes. (D) Gene ontology analysis of statistically significant (q-value < 0.1) up- or down-regulated genes in AcfC compared to wild-type in the two developmental stages. Top five gene ontology terms are displayed.

