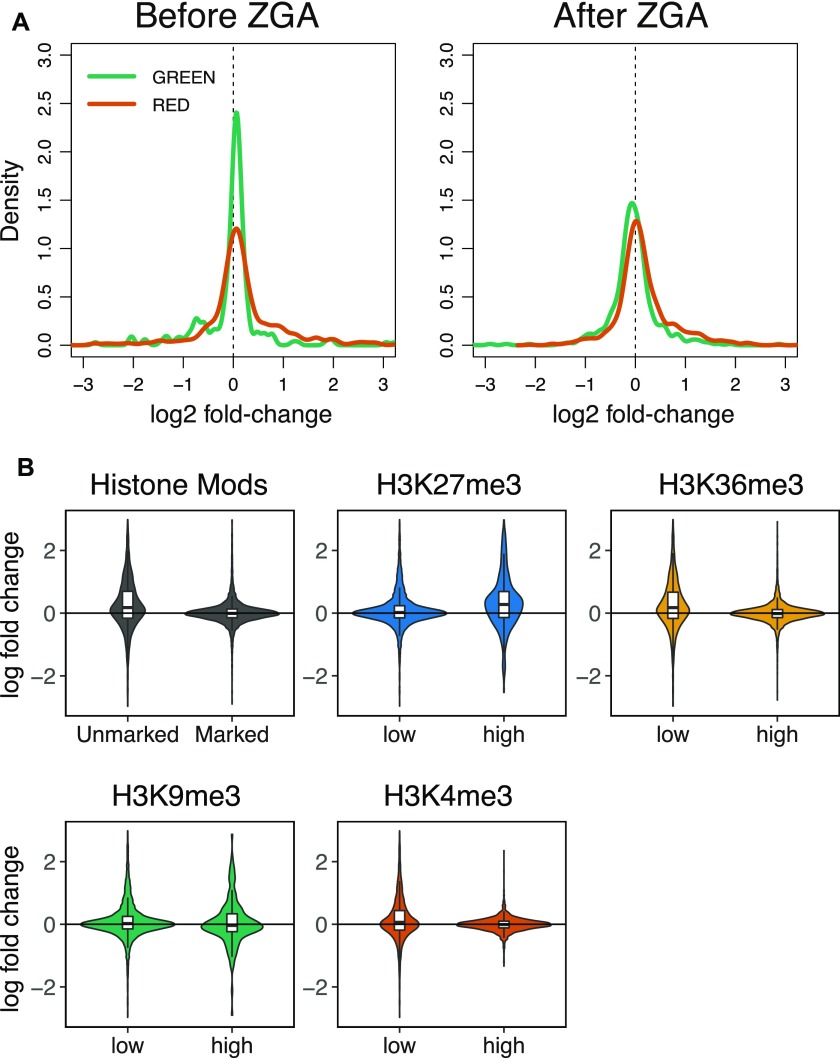
Figure S4.
(A) Comparison of wild-type and AcfC transcriptomes in relation to the chromatin five-state model. Plots represent the distribution of log2 fold-changes for genes belonging to the GREEN and RED chromatin domains before or after ZGA. (B) Violin plots represent the distribution of log2 fold-changes for genes belonging to genomic regions marked or unmarked by the histone marks analyzed (top left panel, Histone Mods), or to genomic regions with high or low occupancy of H3K27me3, H3K36me3, H3K9me3, and H3K4me3 (remaining panels). Boxplots are overlapped to show median values.

