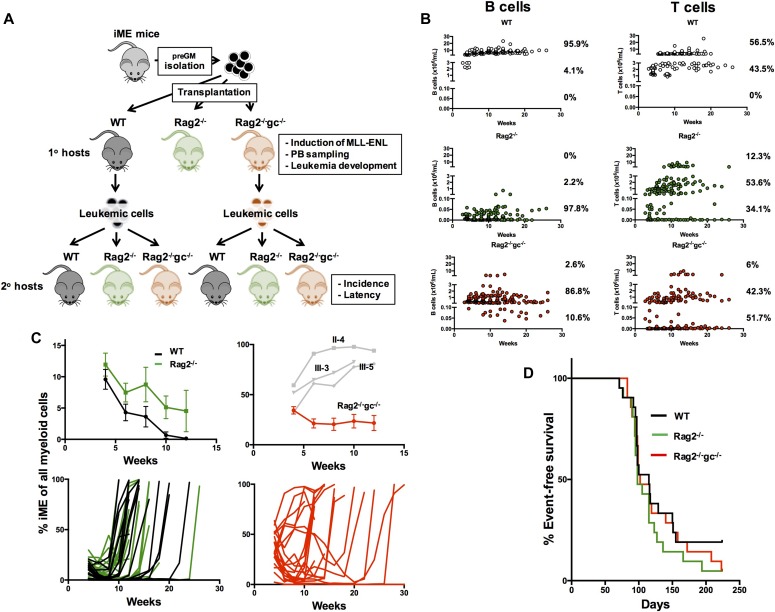
Figure 1. The influence of immunity on transformation into MLL-ENL–driven AML.
(A) Overview of the experimental design. 1,000 preGMs were isolated from iME mice and transplanted into sublethally (350 cGy) irradiated WT, Rag2−/−, and Rag2−/−gc−/− mice. Upon disease development, splenic AML cells were isolated from WT and Rag2−/−gc−/− mice and transplanted at different doses (50,000, 100,000, or 300,000 leukemic cells) into sets of new sublethally irradiated WT, Rag2−/−, and Rag2−/−gc−/− hosts. (B) Total B or T cell numbers derived from iME preGMs in WT, Rag2−/−, and Rag2−/−gc−/− hosts during leukemia development. (C) The pattern of leukemia formation in WT (black lines) and Rag2−/− (green lines) hosts. Top graph, left: the amount of iME myeloid cells as a fraction of all myeloid cells in hosts, before leukemia development. Shown are the means ± SE. Bottom graph, left: the iME myeloid contribution in all WT and Rag2−/− hosts throughout the experiment (n = 21 recipients per group, from three separate experiments). Each line depicts an individual recipient. The pattern of leukemia formation in Rag2−/−gc−/− hosts. Top graph, right: the amount of iME myeloid cells as a fraction of all myeloid cells in hosts, before leukemia development. Shown are the means ± SE. The values in three individual mice in which iME expanded excessively are indicated in grey (these mice were censored from the summary represented by the red curve). Bottom graph, right: the iME myeloid contribution in all Rag2−/−gc−/− hosts throughout the experiment (n = 21 recipients, from three separate experiments). Each line depicts an individual recipient. (D) Kaplan–Meier survival curves of all transplanted primary mice. No significant difference in survival or disease latency was observed between any of the groups.

