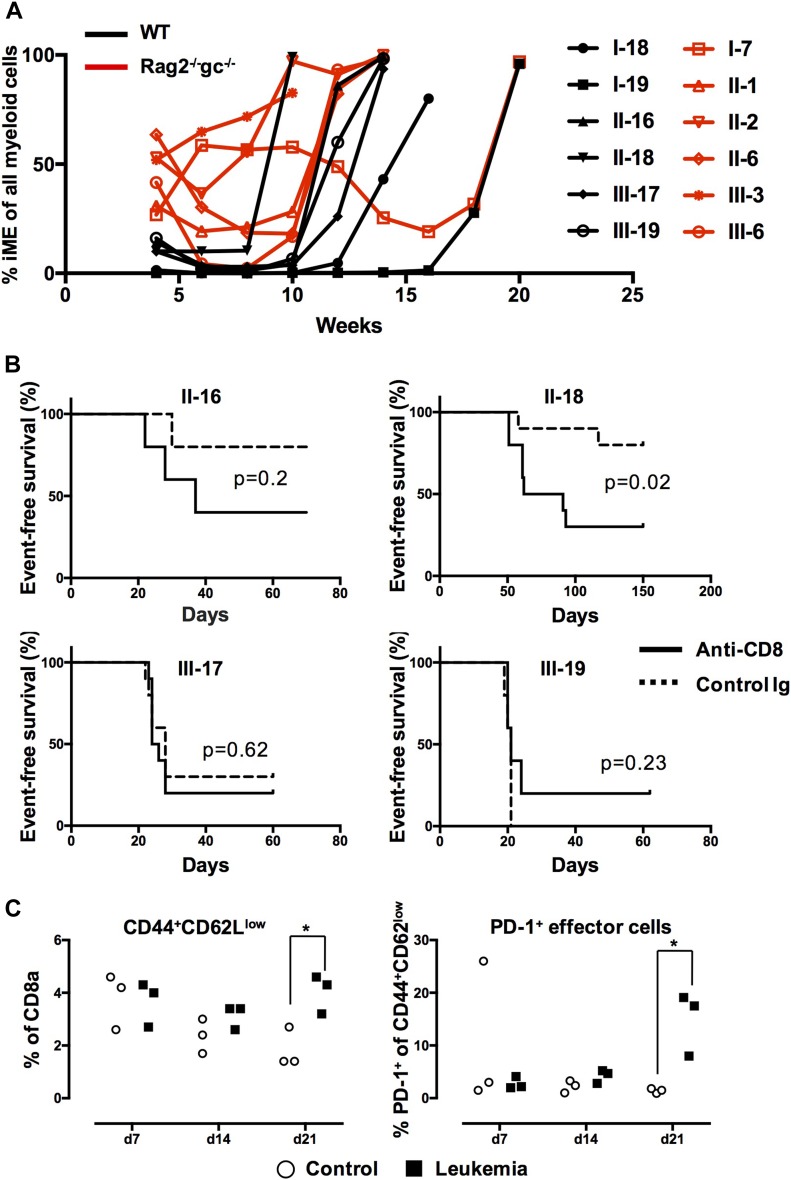
Figure 2. CD8+ T cells underlie the rejection of primary AML in secondary hosts.
(A) The iME contribution to myeloid reconstitution in primary hosts in the 12 separate cases of AML evaluated in secondary recipients (Table 1). Lines represent individual primary mice from which leukemic cells were extracted (black = WT host and red = Rag2−/−gc−/− hosts). (B) Kaplan–Meier curves depicting AML propagation as a consequence of CD8 depletion. Four different leukemic clones were evaluated by transplantation of 50,000 (III-17 and III-19) or 100,000 (II-16 and II-18) AML cells into WT mice. Graphs depict 5 mice per group for clones II-16 and III-19, and 10 mice in each group for clones II-18 and III-17. (C) Sublethally (350-cGy) irradiated WT mice were transplanted with 300,000 AML cells from clone II-16. After 7, 14, and 21 d, the mice were euthanized and the frequency of splenic CD8+ effector cells (CD44hiCD62Llow) analyzed. CD8+ effector cells were in addition analyzed for PD-1 (as an indicator of exhaustion). Data points represent values from individual mice (n = 3 per time point). *P < 0.05.

