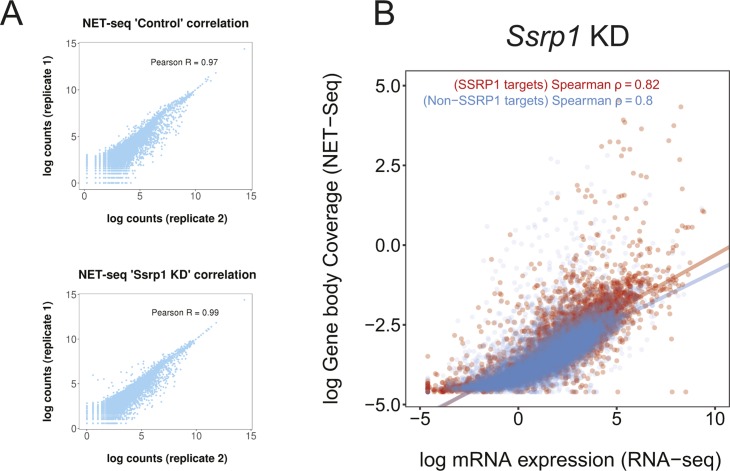
Figure S5. Assessment of NET-seq datasets.
(A) Correlation scatterplots (NET-seq) assessing replicate reproducibility in each condition. Pearson's correlation is indicated at the top of each plot. (B) Scatterplots of log gene body coverage (NET-seq) versus log mRNA expression (RNA-seq) for SSRP1 (n = 4,576) and non-SSRP1 (n = 8,844) target regions in the Ssrp1 KD state (z-score = 7.2, P < 1 × 10⁻⁵).

