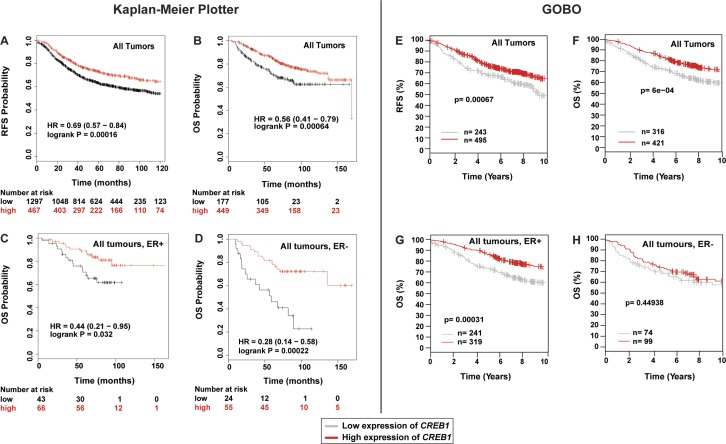
Figure S12. Comparative analyses of the correlation between CREB1 expression levels and outcome in breast cancer using two different tools and datasets.
(A–D) Interrogation of The Cancer Genome Atlas with the “Kaplan–Meier Plotter.” The numbers indicated below the panels correspond to the number of cases at the time points indicated in the graphs. Note that the numbers of breast tumors for the analyses of panels C and D were comparatively low. (E–H) Comparable sets of samples and types of analyses with the GOBO tool.

