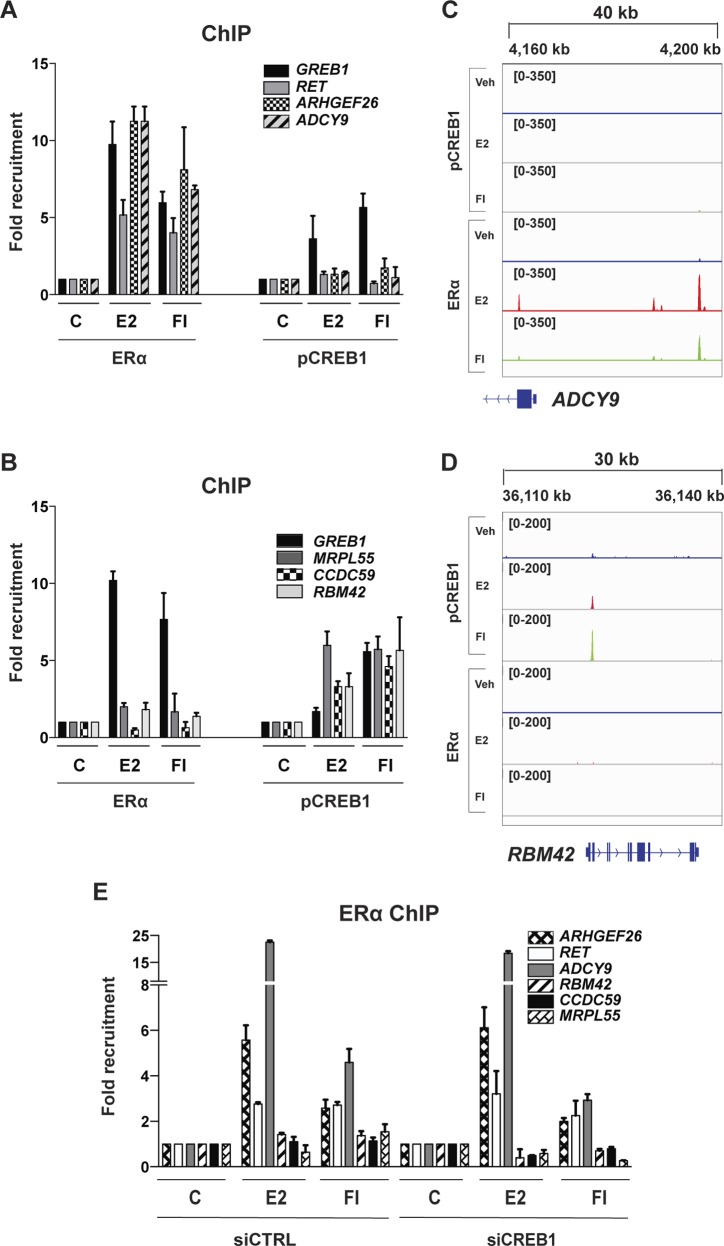
Figure S7. Recruitment of pCREB1 and ERα to their respective unique binding sites.
(A, B) ERα and pCREB1 recruitment to sites that are not bound by pCREB1. ChIP experiments with MDA-MB-134 cells stimulated with E2 or FI. With this set of genes, the ERα binding site of GREB1 serves as a control of a site bound by both transcription factors. (C, D) Snapshots from the ChIP-seq data for both ERα and pCREB1 peaks are shown across indicated genes for DMSO (blue), E2 (red), and FI (green). Genomic coordinates are indicated. (E) ChIP experiments of ERα with MDA-MB-134 cells stimulated with E2 or FI, with and without CREB1 knockdown. See also Fig S8 for additional examples.

