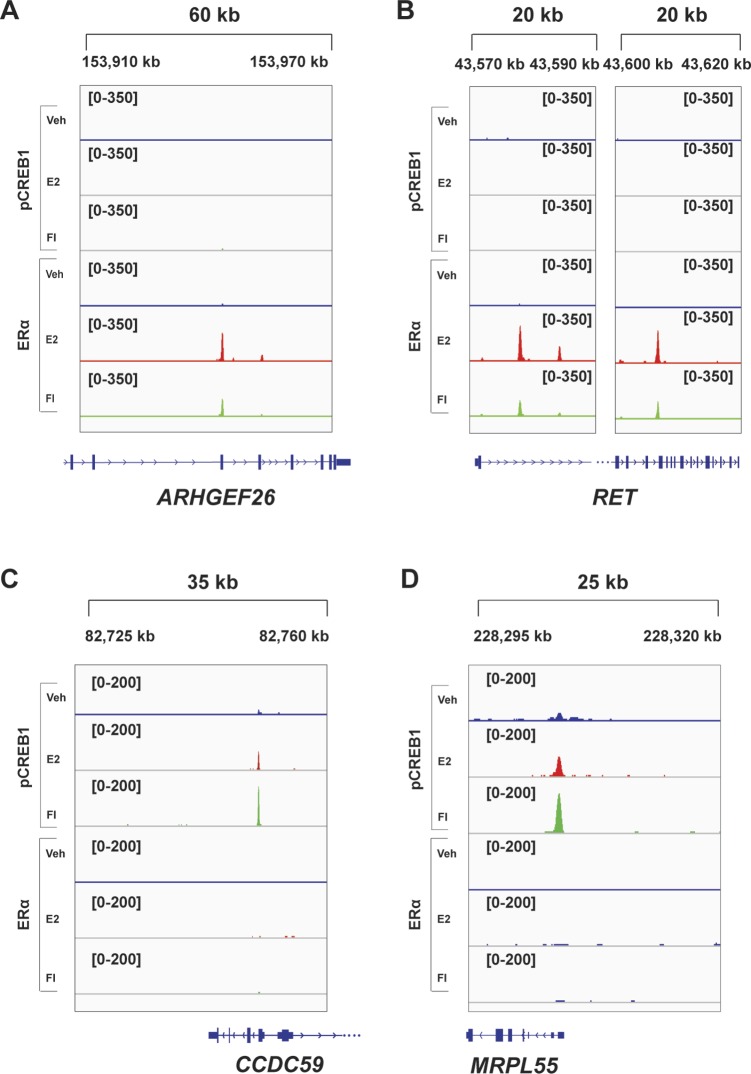
Figure S8. Additional examples of unique ERα or pCREB1 peaks.
(A–D) Snapshots for unique peaks associated with genes of either (A, B) ERα or pCREB1 (C, D) from the ChIP-seq data of MDA-MB-134 cells. Genomic coordinates are indicated. This figure complements Fig S7.

