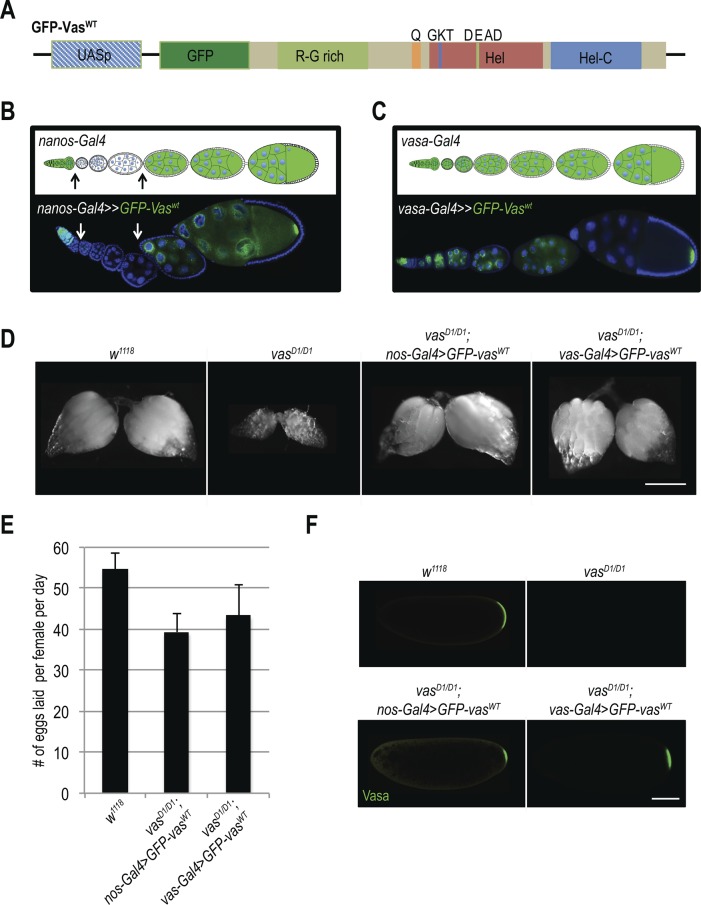
Figure S1. Vasa's helicase activity is essential for oogenesis.
(A) Schematic representation of transgenic construct GFP-VasWT. (B) Expression patterns of nos-Gal4. Schematic representation of the stages at which nos promoter is active (upper panel, green). Confocal image of an ovariole expressing GFP-VasWT (GFP signal, green) under the control of nos-Gal4 (bottom panel). (C) Expression patterns of vas-Gal4. Schematic representation of the stages at which vas promoter is active (upper panel, green). Confocal image of an ovariole expressing GFP-VasWT (GFP signal, green) under the control of vas-Gal4 (bottom panel). (D) Morphology of ovaries of WT (w1118), vasD1/D1; nos-Gal4>GFP-vasWT, and vasD1/D1; vas-Gal4>GFP-vasWT flies. Scale bar indicates 250 μm. (E) Egg-laying rates of WT (w1118), vasD1/D1; nos-Gal4>GFP-vasWT, and vasD1/D1; vas-Gal4>GFP-vasWT flies. Error bars represent the standard deviation among three biological replicates (Table S2). (F) Immunodetection of Vasa in early embryos produced by WT (w1118), vasD1/D1; nos-Gal4>GFP-vasWT, and vasD1/D1; vas-Gal4>GFP-vasWT females. Scale bar indicates 100 μm (related to Fig 1).

