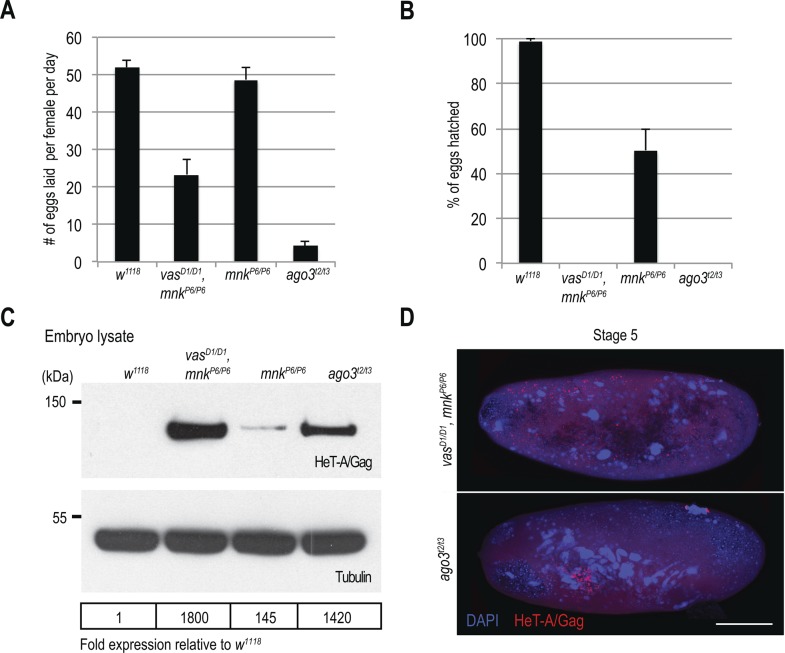
Figure S4. HeT-A/Gag protein is de-repressed in vas, mnk double mutant flies.
(A) Egg-laying rates of WT (w1118), vasD1/D1, mnkP6/P6 double mutant, and mnkP6/P6 and agot2/t3 single mutant. Error bars represent the standard deviation among three biological replicates (Table S5). (B) Hatching rates of eggs laid by WT (w1118), vasD1/D1, mnkP6/P6 double mutant, and mnkP6/P6 and agot2/t3 single mutant flies. Error bars represent the standard deviation among three biological replicates (Table S5). (C) Western blot analysis using antibodies against HeT-A/Gag showing protein levels in early embryos produced by WT (w1118), vasD1/D1, mnkP6/P6 double mutant, and mnkP6/P6 and agot2/t3 single mutant flies. Tubulin was used as a loading control. The table shows quantification of HeT-A/Gag protein levels relative to WT. HeT-A/Gag signal was normalized to tubulin signal in individual experiments and was set to one in WT. (D) Immunodetection of HeT-A/Gag protein in vasD1/D1, mnkP6/P6 double mutants, and agot2/t3 single mutant stage 5 embryos. Selected areas of stage 5 embryos are presented in Fig 3D. Scale bars indicate 100 μm (related to Fig 3).

