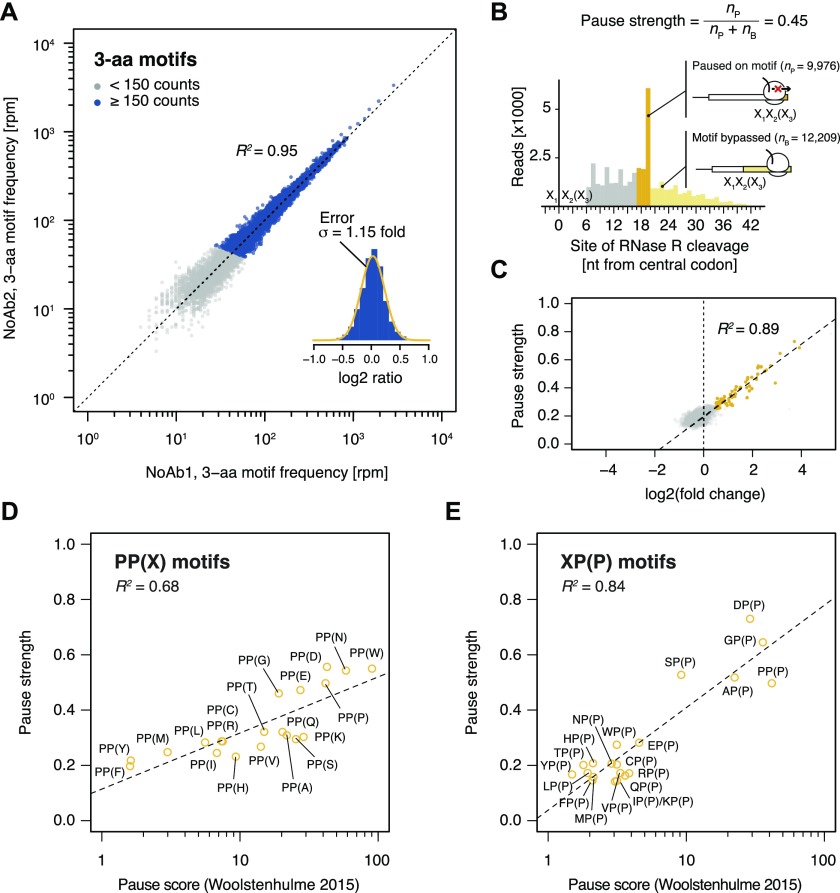
Figure 2. Motif pause strength correlates with enrichment on inverse toeprinting.
(A) 3-aa motif frequencies in reads per million (rpm) from two independent inverse toeprinting experiments performed after translation in the absence of antibiotic (NoAb1 and NoAb2). The inset represents a histogram of log2 ratios between replicates for 3-aa motifs having low statistical counting error (i.e., with >150 counts [blue], Fig S5), with an overlaid normal error curve (mean = 0.02, SD = 0.2 log2 units, equivalent to σ = 1.15 fold). (B) Formula used to calculate pause strength for an X1X2(X3) motif, with the amino acid in the ribosomal A-site in brackets. (C) Plot of pause strength against log2 (fold change) of all possible 3-aa motif frequencies relative to the NNS15 library. Yellow points correspond to intrinsic 3-aa pause motifs with a pause strength ≥0.25. All other motifs are shown as gray dots. (D, E) Plot of pause strengths calculated in this study against pause scores calculated from ribosome profiling data obtained from E. coli cells lacking EF-P, for (D) PP(X) and (E) XP(P) motifs (Woolstenhulme et al, 2015). The scores obtained by both methods are strongly correlated, as indicated by R2 values of 0.68 and 0.84 for PP(X) and XP(P) motifs, respectively.

