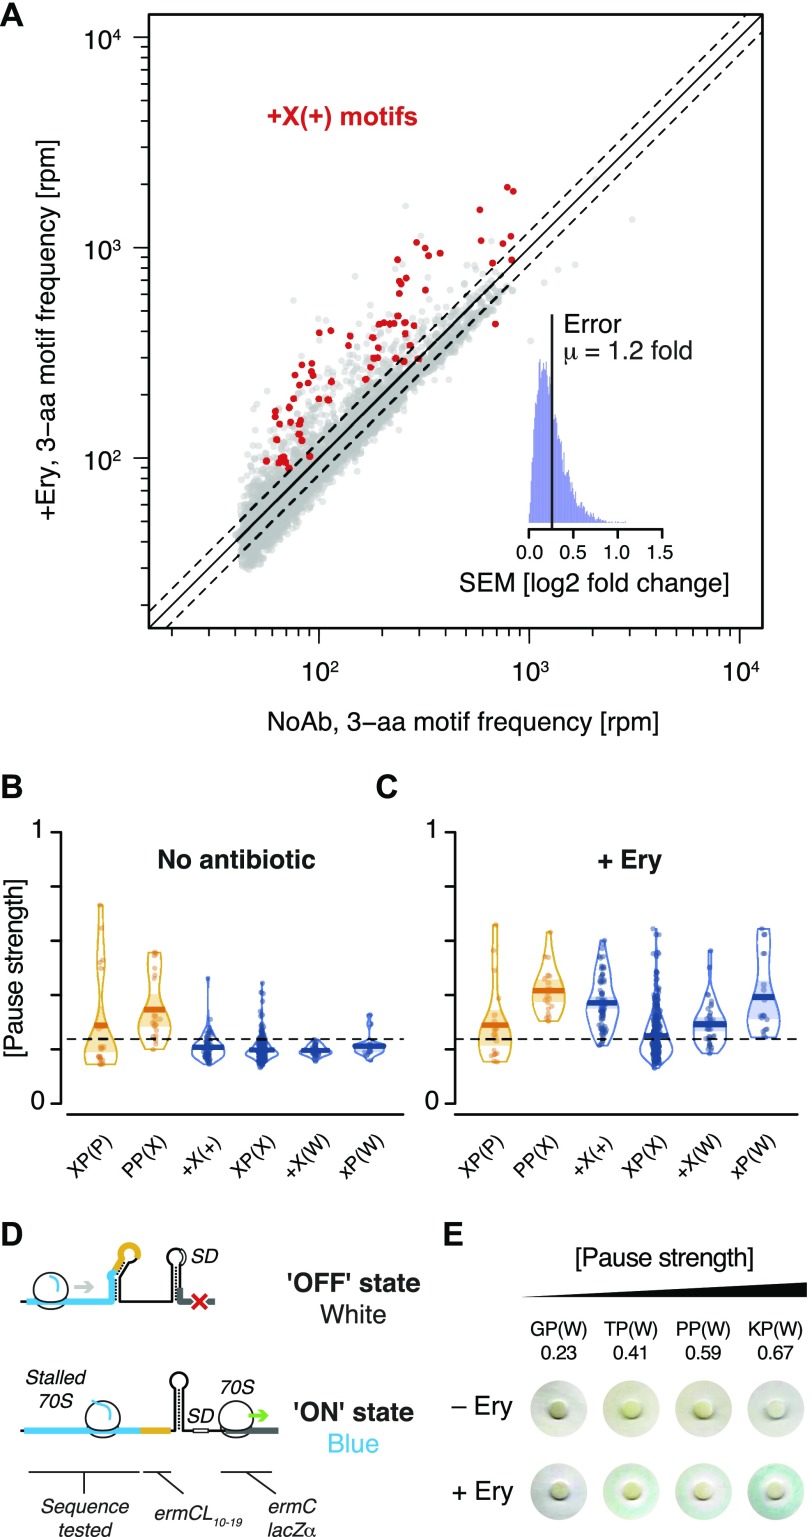
Figure 3. Nascent peptide-dependent translational arrest in response to Ery.
(A) Frequency of occurrence of 3-aa motifs with low statistical counting error in inverse toeprints obtained in the absence or presence of Ery, with +X(+) motifs indicated in red. The inset represents a histogram of the SEM of the log2 fold change in 3-aa motif frequency upon addition of Ery. The upper and lower dotted lines (gray) indicate 1.20 and 0.83-fold changes, respectively, corresponding to the mean (μ) of the distribution of SEM (log2 fold change). (B, C) RDI (raw data, description and inference) plot showing pause strengths for individual motifs translated in the (B) absence or (C) presence of Ery. Polyproline motifs are shown in yellow and all other motifs are in blue. The horizontal dashed line corresponds to the 0.25 pause strength cutoff used to identify motifs that are enriched upon addition of Ery. (D) Overview of the lacZα-complementation assay used to test the in vivo activity of ErmBL variants (modified from Bailey et al [2008]). (E) Disc-diffusion test plates used to assay the ability of nascent formyl-MAXP(W) to cause translational arrest in vivo. Discs marked with +Ery contain this antibiotic and blue rings result from the induction of a lacZα reporter in response to ribosome stalling at an upstream test ORF (modified from Bailey et al [2008]).

