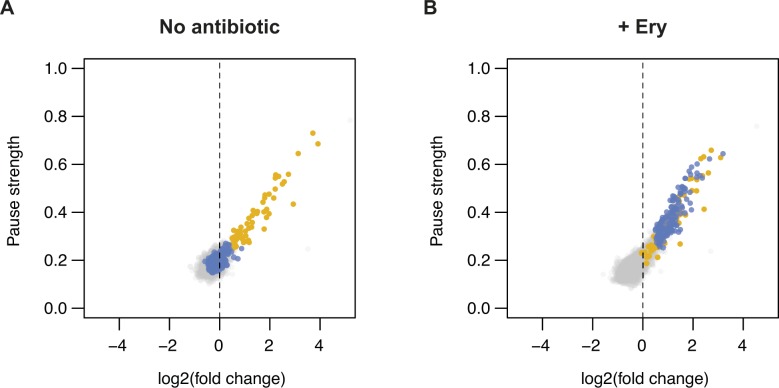
Figure S10. Enrichment of 3-aa motifs upon addition of Ery.
(A and B) Plots of pause strength against log2 (fold change) for all possible 3-aa motifs, translated in the (A) absence or (B) presence of Ery. Yellow points correspond to 3-aa motifs that induce translational pausing in the absence of antibiotics. Blue points correspond to motifs with pause strengths ≥0.25 in the presence of Ery and ≥1.5-fold greater than in the absence of a drug, which show a log2 (fold change) in frequency of ≥0.5. All other motifs are shown as gray dots.

