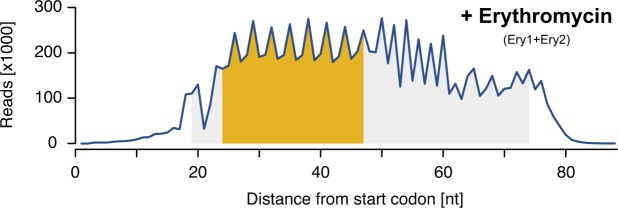
Figure S7. Size distribution of inverse toeprints obtained in the presence of Ery.
Size distribution of inverse toeprints from two biological replicates with a minimum Q-score of 30 obtained from an NNS15 library translated in the presence of Ery (Ery1 + Ery2). The fragment size range shaded in gray corresponds to the bands that were cut from a 12% TBE-acrylamide gel, whereas the range in yellow indicates fragments used in our analysis.

