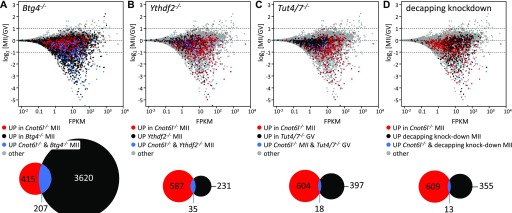
Figure 5. Comparison of transcriptome changes in Cnot6l−/− MII eggs with other experimental data.
(A) Comparison with Btg4−/− eggs (13). (B) Comparison with Ythdf2−/− eggs (15). (C) Comparison with Tut4/7−/− GV oocytes (28). (D) Comparison with eggs lacking production of the decapping complex (16). In each case, significantly up-regulated transcripts in MII eggs were compared with up-regulated transcripts in Cnot6l−/−MII eggs (Fig 3D). All MA plots were constructed from wild-type control replicates from GSE116771.

