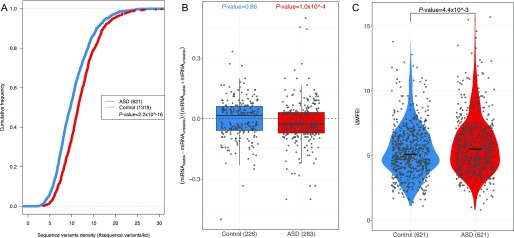
Figure 3. Sequence features that were correlated with ASD.
(A) The cumulative distribution function (CDF) of SNP density (number of SNPs per kb) for genes with significant ASD (red) and without (control genes, blue). Compared with the control genes, the genes with significant ASD showed significantly higher SNP density (P-value ˂ 2.2 × 10⁻¹⁶, two-sided Kolmogorov–Smirnov test). (B) Box plots and scatterplots showing the distribution of miRNA-binding site number difference between the stable and unstable alleles for genes with significant ASD and controls. For controls, the difference centered around zero (P-value = 0.86, two-sided Mann–Whitney U test), whereas in ASD genes, unstable alleles tend to possess more miRNA target sites than the stable alleles (P-value = 1.0 × 10⁻⁴, two-sided Mann–Whitney U test). Only the genes with ≥10 miRNA-binding sites combining the two alleles together and ≥1 different sites between the two alleles were used. (C) Violin plots and scatterplots comparing the distribution of the absolute MFE difference (|ΔMFE|) between ASD genes and controls. The horizontal lines indicate the median. Compared with controls, ASD genes exhibited larger allelic differences (P-value = 4.4 × 10⁻³ two-sided Mann–Whitney U test).

