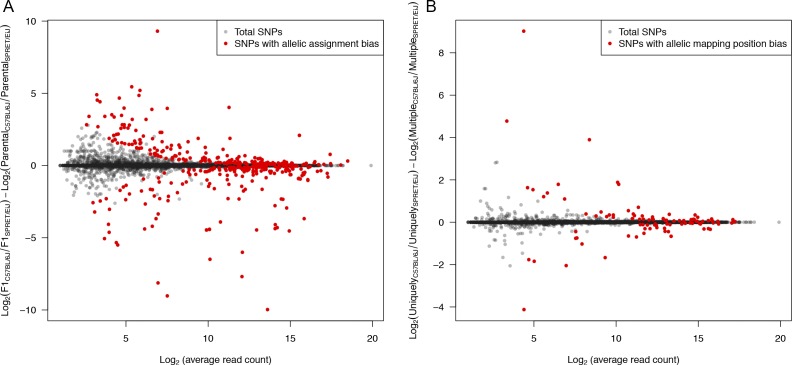
Figure S2. Filtering of SNP loci with potential allelic mapping and assignment biases.
(A) Scatterplot comparing log2-transformed fold change of gene expression between parental strains and the two alleles in mock F1 hybrid created by mixing parental strain sequencing reads (see the Materials and Methods section for details). (B) Scatterplot comparing log2-transformed fold change of the two alleles between using uniquely mapped reads only and those including also multiple mapped reads.

