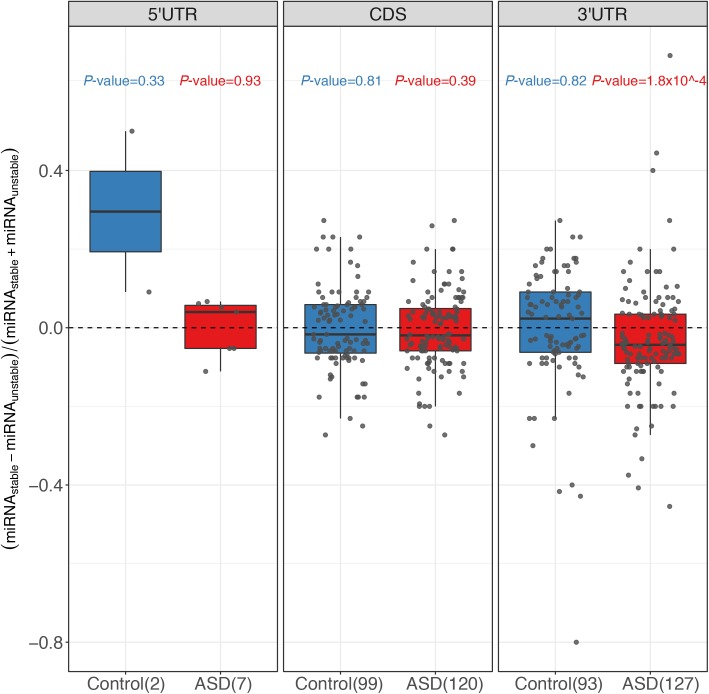
Figure S8. Comparison of miRNA-binding sites in different regions.
Box plots and scatterplots showing the distribution of miRNA-binding site number difference between the stable and unstable alleles for genes with significant ASD and controls for top 50 highly expressed miRNAs in 5′ UTR, CDS, and 3′ UTR, respectively.

