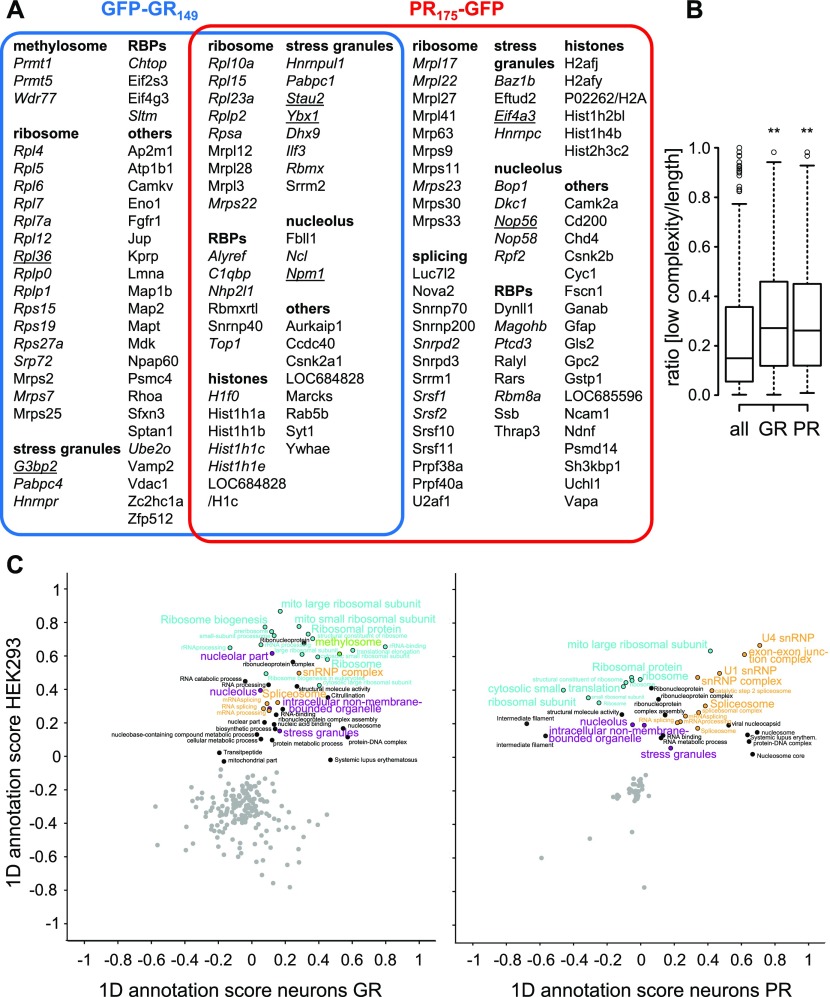
Figure 1. Poly-GR and poly-PR interact with similar low-complexity proteins in neurons.
Quantitative proteomics of GFP immunoprecipitations from primary cortical neurons transduced with GFP, GFP-(GR)149, or (PR)175-GFP (DIV7 + 8). The complete dataset is available in Table S1. (A) Proteins with significant enrichment in poly-GR/PR interactomes compared with GFP control were manually grouped into functional categories. Orthologues of proteins in italics were also found in the poly-GR/PR interactomes from HEK293 cells. Underlined proteins are analyzed in this paper. (B) Proportion of low-complexity regions (IUPred-L) of all proteins identified in the neuronal interactome analysis, the poly-GR interactome, and the poly-GR interactome. Significance of difference was assessed with the Mann–Whitney–Wilcoxon test, exact P-values: GFP versus GFP-(GR)149, P = 0.004566 and GFP versus (PR)175-GFP, P = 0.001656. Whiskers extend to ±1.5 box height (i.e., total three times the interquartile range). (C) 2D analysis of GO enrichment terms (GOMF, GOCC, GOCC, GOPB, KEGG, and UniProt keywords) and stress granule proteins (Jain et al, 2016) for proteins found in the poly-GR and poly-PR interactome in primary neurons and HEK293 cells (Fig S2 and Tables S1 and S2). Some dots with nearly identical position and annotation were removed for clarity. Related terms from the main enriched pathways are labeled in the same color. Annotation terms with a Benjamini–Hochberg FDR (q-value) <0.1 and comprising at least six proteins quantified by mass spectrometry are shown. 1D annotation scores close to 1 indicate strongest enrichment over the GFP control, scores close to 0 indicate no enrichment, and scores close to –1 indicate strongest depletion. The analysis was performed in Perseus software (Tyanova et al, 2016).

