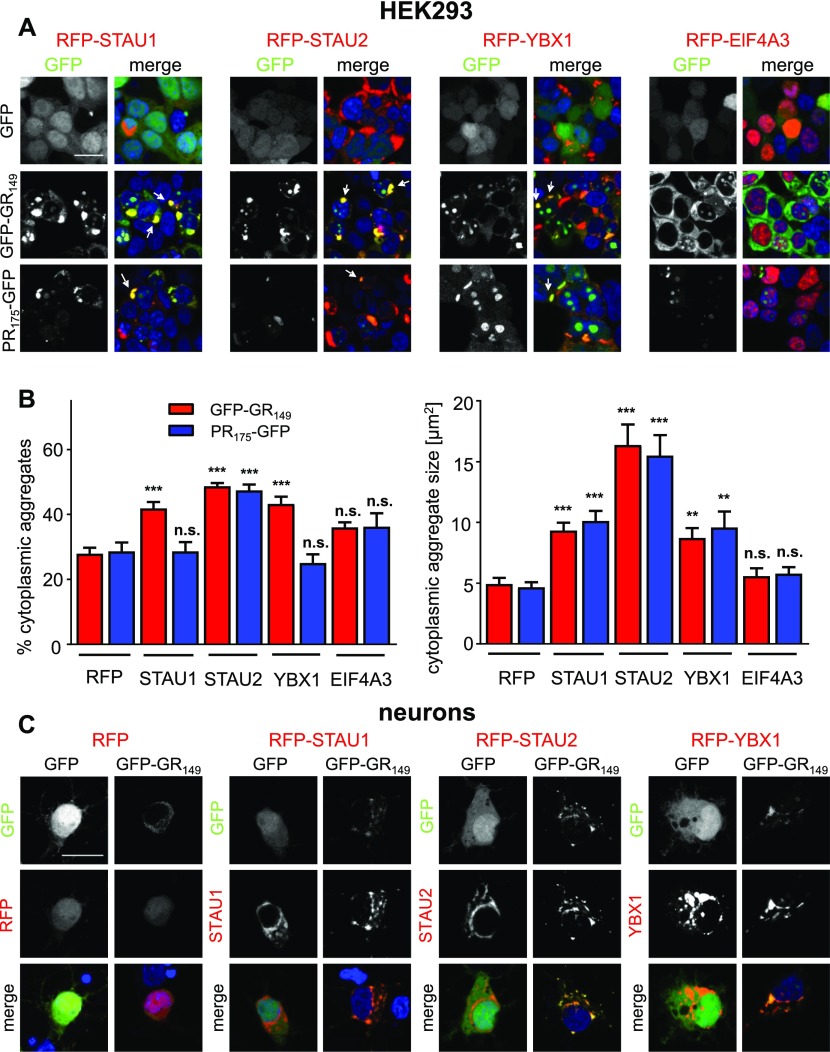
Figure 3. STAU1/2 and YBX1 recruit poly-GR/PR into large cytoplasmic granules.
HEK293 cells and primary cortical neurons were co-transfected with GFP, GFP-(GR)149, or (PR)175-GFP expression vectors and RFP-tagged interactors associated with stress granules. (A) Immunofluorescence images of HEK293 cells showing co-expression of RFP-STAU1/2, RFP-YBX1, or RFP-EIF4A3 together with GFP-(GR)149, (PR)175-GFP, or GFP. STAU1/2 and YBX1 reroute poly-GR and poly-PR into large cytoplasmic structures (white arrows). Left columns show GFP signal, right columns show merge of GFP, RFP-tagged proteins, and nuclear DAPI staining (blue). Scale bar denotes 20 μm. (B) Quantifications of cytoplasmic poly-GR/PR granules from (A). Left bar graph shows percentage of cytoplasmic granules out of all granules (in nucleolus and cytoplasm) in poly-GR (red bars) and poly-PR (blue bars) (GR/RFP, n = 16 images (40×) from two independent experiments: PR/RFP, n = 14; GR/RFP-STAU1, n = 19; PR/RFP-STAU1, n = 20; GR/RFP-STAU2, n = 10; PR/RFP-STAU2, n = 8; GR/RFP-YBX1, n = 14; PR/RFP-YBX1, n = 14; GR/RFP-EIF4A3, n = 6; and PR/RFP-EIF4A3, n = 6). Cytoplasmic granule size is represented by the right bar graph (GR/RFP, n = 130 aggregates from two individual experiments; PR/RFP, n = 132; GR/RFP-STAU1, n = 104; PR/RFP-STAU1, n = 132; GR/RFP-STAU2, n = 123; PR/RFP-STAU2, n = 65; GR/RFP-YBX1, n = 119; PR/RFP-YBX1, n = 53; GR/RFP-EIF4A3, n = 93; and PR/RFP-EIF4A3, n = 71). Mean ± SEM is shown, exact P-values for left graph: GR/RFP-STAU1 versus GR/RFP, P = 0.0001; GR/RFP-STAU2 versus GR/RFP, P = 0.0001; GR/RFP-YBX1 versus GR/RFP, P = 0.0001; GR/RFP-EIF4A3 versus GR/RFP, P = 0.0775; PR/RFP-STAU1 versus PR/RFP, P = 0.9999; PR/RFP-STAU2 versus PR/RFP, P = 0.0007; PR/RFP-YBX1 versus PR/GFP, P = 0.7820; PR/RFP-EIF4A3 versus PR/RFP, P = 0.3936; exact P-values for right graph: GR/RFP-STAU1 versus GR/RFP, P = 0.0001; GR/RFP-STAU2 versus GR/RFP, P = 0.0001; GR/RFP-YBX1 versus GR/RFP, P = 0.0023; GR/RFP-EIF4A3 versus GR/RFP, P = 0.9672; PR/RFP-STAU1 versus PR/RFP, P = 0.0001; PR/RFP-STAU2 versus PR/RFP, P = 0.0001; PR/RFP-YBX1 versus PR/RFP, P = 0.0023; and PR/RFP-EIF4A3 versus PR/RFP, P = 0.8492 in one-way ANOVA with Dunnett’s posttest. (C) Immunofluorescence images of transfected neurons (DIV7 + 3) co-expressing RFP-STAU1, RFP-STAU2, or RFP-YBX1, and GFP-(GR)149 or GFP obtained by confocal microscopy are shown. Top row shows GFP signal, middle row shows RFP-tagged interactor or RFP control, and bottom row shows merge including nuclear DAPI (blue). Comparison of the largely homogenous poly-GR pattern in the RFP with punctate distribution in neurons co-expressing RFP-STAU1/2 and YBX1.

