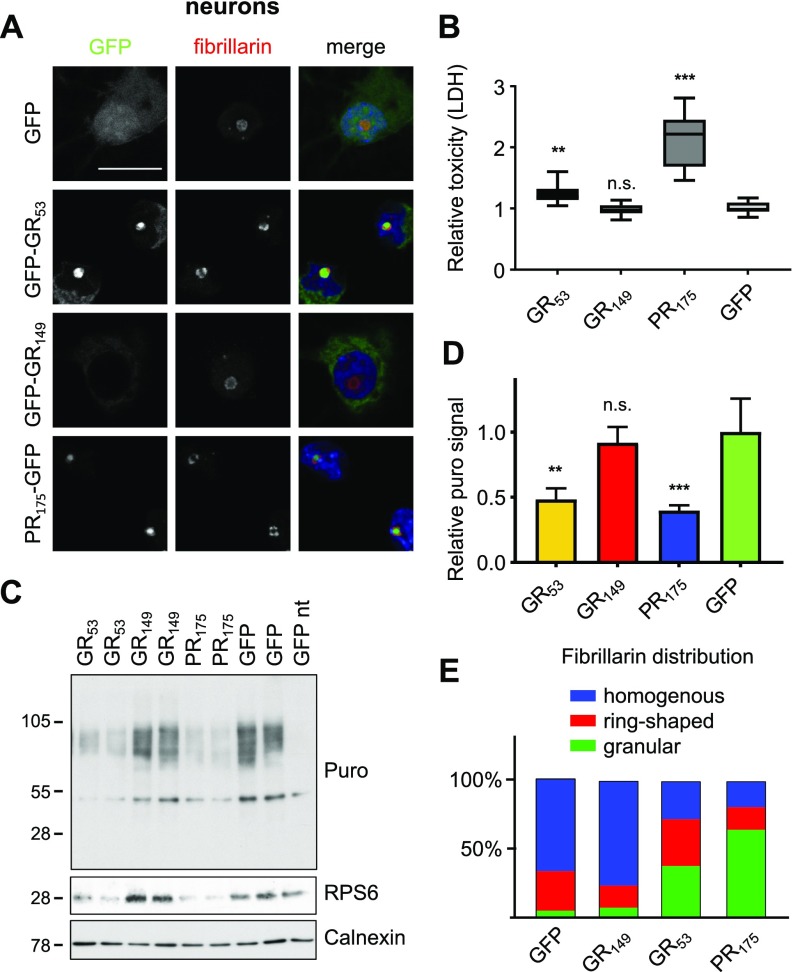
Figure 7. Nucleolar poly-GR/PR alter nucleolar organization and inhibit translation.
GFP, GFP-(GR)53, GFP-(GR)149, or (PR)175-GFP were transduced in primary rat neurons. (A) Images show fibrillarin immunofluorescence staining of hippocampal neurons. Left two columns represent GFP signal and fibrillarin staining in different DPR species as indicated. Right column shows merge with additional nuclear DAPI staining in blue. Scale bar denotes 20 μm. (B) LDH release assay detects significant cell death on lentiviral expression of (PR)175-GFP and GFP-(GR)53 but not GFP-(GR)149 compared with GFP control in primary rat neurons (DIV7 + 14) (n = 3 independent experiments with six replicates each; box plot is shown with 25th percentile, median, and 75th percentile; and whiskers represent minimum and maximum; exact P-values: GFP versus GFP-GR53, P = 0.0011; GFP versus GFP-GR149, P = 0.9954; and GFP versus PR175-GFP, P = 0.0001 in one-way ANOVA with Dunnett’s posttest). (C) SUnSET experiment in GFP-(GR)53–, GFP-(GR)149–, (PR)175-GFP–, or GFP–expressing primary cortical neurons (DIV6+7) as in Fig 6C. Cells were incubated with 1 μM puromycin (puro) for 10 min or not treated (nt). Note the reduced incorporation of puromycin in neurons expressing GFP-(GR)53 and (PR)175-GFP. (D) Quantification of puromycin signal normalized to calnexin (n = 6 from three independent experiments, mean ± SEM, exact P-values: GFP versus GFP-GR53, P = 0.0022; GFP versus GFP-GR149, P = 0.8638; and GFP versus PR175-GFP, P = 0.0005 in one-way ANOVA with Dunnett’s posttest). (E) Quantification of fibrillarin distribution within the nucleolus from (A). n = 6 to 16 images were analyzed.

