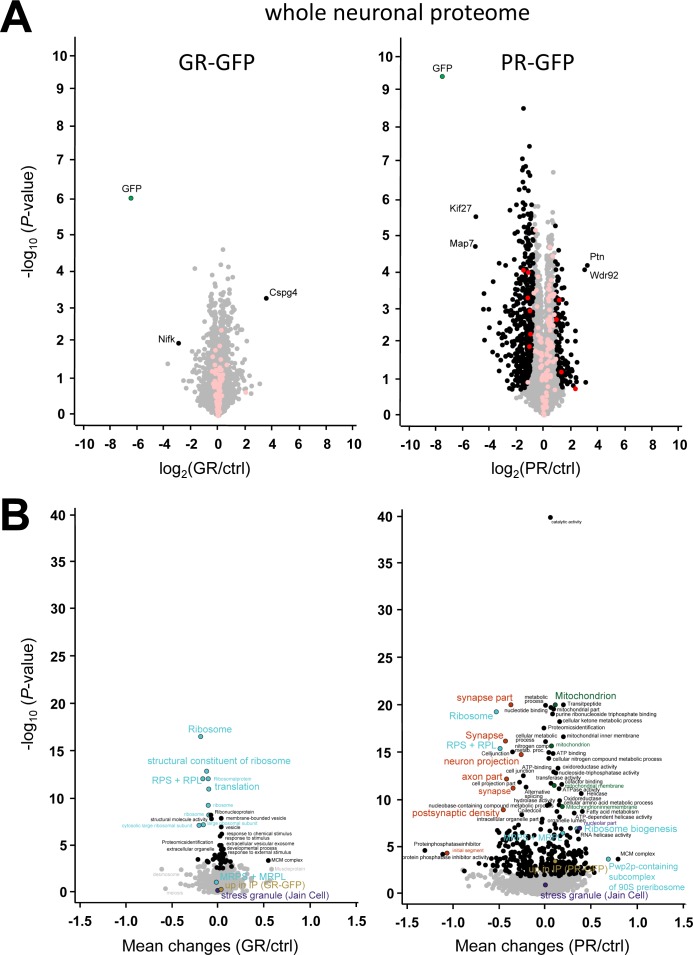
Figure S6. Poly-PR expression strongly affects the neuronal proteome.
(A) Volcano plot showing individual proteins quantified in whole proteome of GFP-(GR)149– and (PR)175-GFP–transduced primary cortical neurons from the same set used for interactome analysis in Figs 1A and S2A. The data for all proteins are plotted as log2-fold change versus the −log10 of the P-value. Significantly different proteins (q-value < 5%) are highlighted as black dots. Proteins significantly enriched (q-value < 5%) in the poly-GR/PR immunoprecipitates are shown in red. Transparent black and red dots denote proteins that are not significantly changed. (B) Volcano plot depicting enriched annotations (1D annotation enrichment) for respective proteome comparisons of GO terms (GOMF, GOCC, GOCC, GOPB, KEGG, UniProt keywords, stress granule proteins (Jain et al, 2016), and proteins enriched in the neuronal poly-GR/PR interactome). Benjamini–Hochberg FDR–significant (q-value < 5%) annotations are indicated in color or in black. The analysis was performed in Perseus software. Some dots with nearly identical position and annotation were removed for clarity. Related terms from the main pathways are labeled in the same color. Raw data are presented in Table S3.

