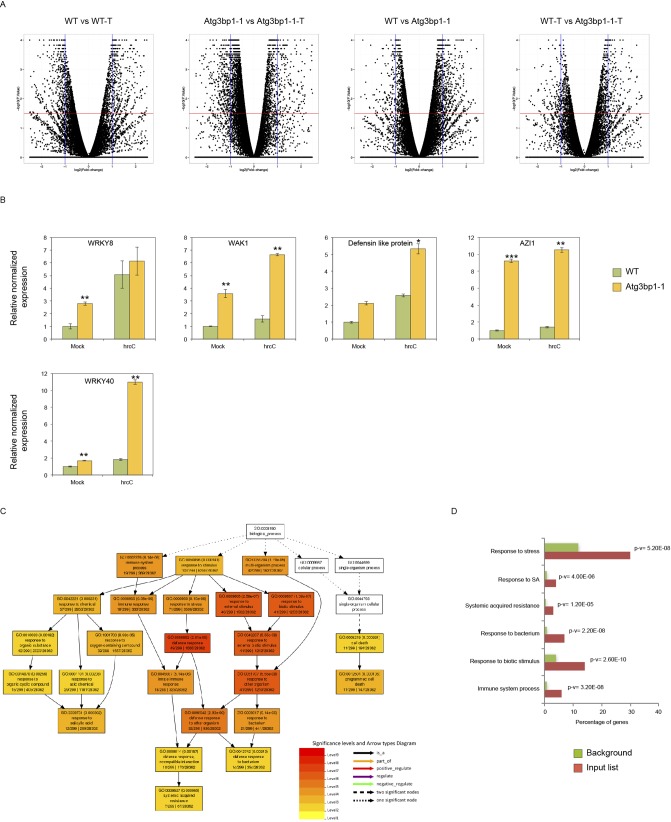
Figure S3. RNAseq–Volcano plots, qPCR validation, and GO enrichment analysis.
(A) Volcano plots of the transcriptomes of WT and Atg3bp1-1 plants with and without Pst hrcC− treatment (WT versus WT-treated, Atg3bp1-1 versus Atg3bp1-1-treated, WT versus Atg3bp1-1, and WT-treated versus Atg3bp1-1-treated). The horizontal line and vertical lines indicate the significance threshold (FDR < 0.05) and twofold change threshold (log2 foldchange > 1), respectively. (B) Expression of AtG3BP1-regulated genes in the WT and Atg3bp1-1 14-d-old seedlings. Transcript levels were determined by qRT-PCR relatively to Col-0 WT (set at 1). UBQ10 and actin expression levels were used for normalization. (C, D) GO enrichment analysis of genes induced upon microbial treatment using AgriGO V2. The fold enrichment was calculated based on the frequency of genes annotated to the term compared with their frequency in the genome.

