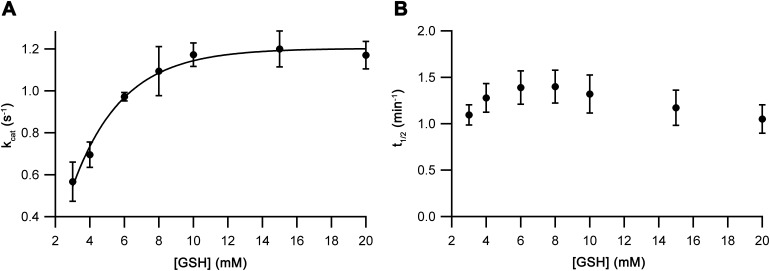
Figure S8. Kinetics of GSH dependence.
Oxygen consumption traces for Ero1β complex with varying [GSH] were collected similarly to the Ero1 traces from Fig 2. kcat values (A) and halftime of activation (B) were plotted versus [GSH] (n = 3, mean ± SD).

