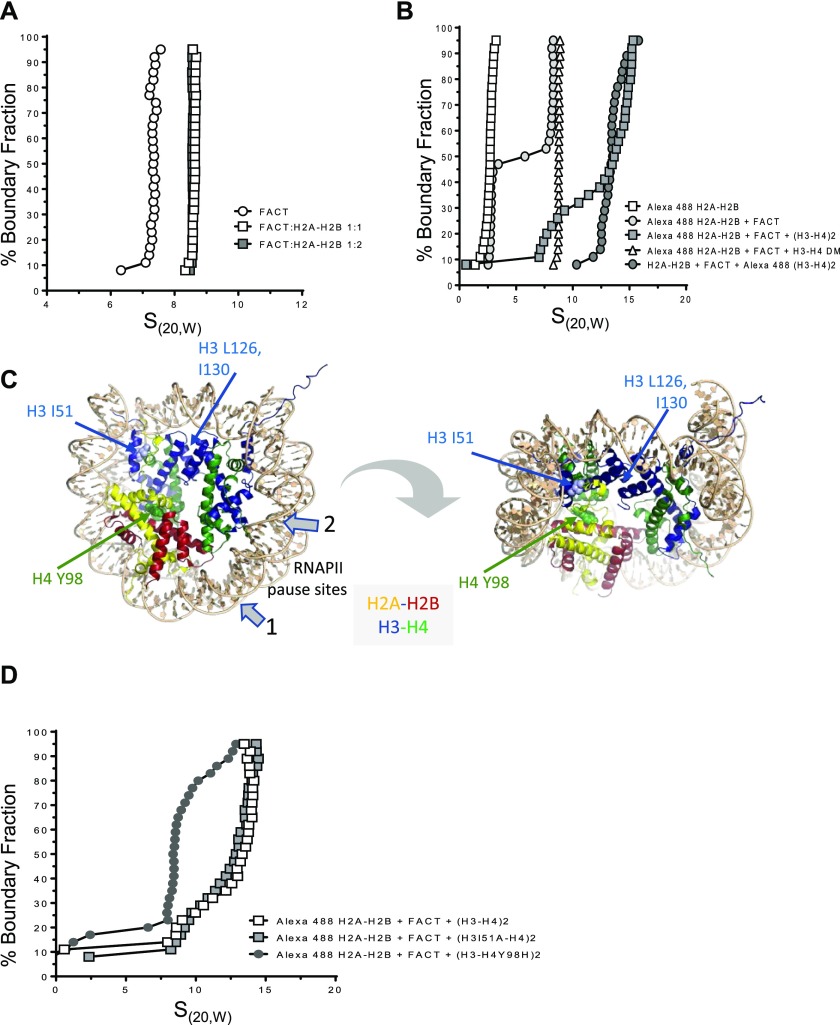
Figure 1. H2A–H2B facilitates FACT interaction with the (H3–H4)2 tetramer to form a ternary complex.
(A) SV-AUC of histone–FACT complexes. Absorbance is represented in a van Holde–Weischet plot. 1.8 μM FACT was mixed with H2A–H2B at the indicated molar ratios. H2A–H2B sediments between 1.7 and 2.5S (B). (B) SV-AUC of histone–FACT complexes, by monitoring the sedimentation of fluorescently labeled histone H2B or H3 (*) with an FDS (488 nm). Open squares: 100 nM H2A–H2B*; open circles: 100 nM H2A–H2B* + 200 nM FACT; closed squares: 100 nM H2A–H2B* + 400 nM FACT + 400 nM H3–H4; closed circles: 100 nM H2A–H2B + 400 nM FACT + 400 nM H3–H4*. Open triangles: 100 nM H2–H2B*, 400 nM FACT, and 400 nM DM–H3–H4. (C) H3I51 and H4Y98 are shown in space filling representation in 1AOI. RNAPII pause sites specific to FACT are indicated with grey arrows; the location of H3L126 and I130 is also indicated. (D) SV-AUC of H2A–H2B* (100 nM) with either 400 nM H3–H4, H3I51A–H4, or H3–H4Y98H, and 400 nM FACT. Alexa 488 fluorescence was monitored with the FDS. S values from all SV-AUC experiments are listed in Table 1.

