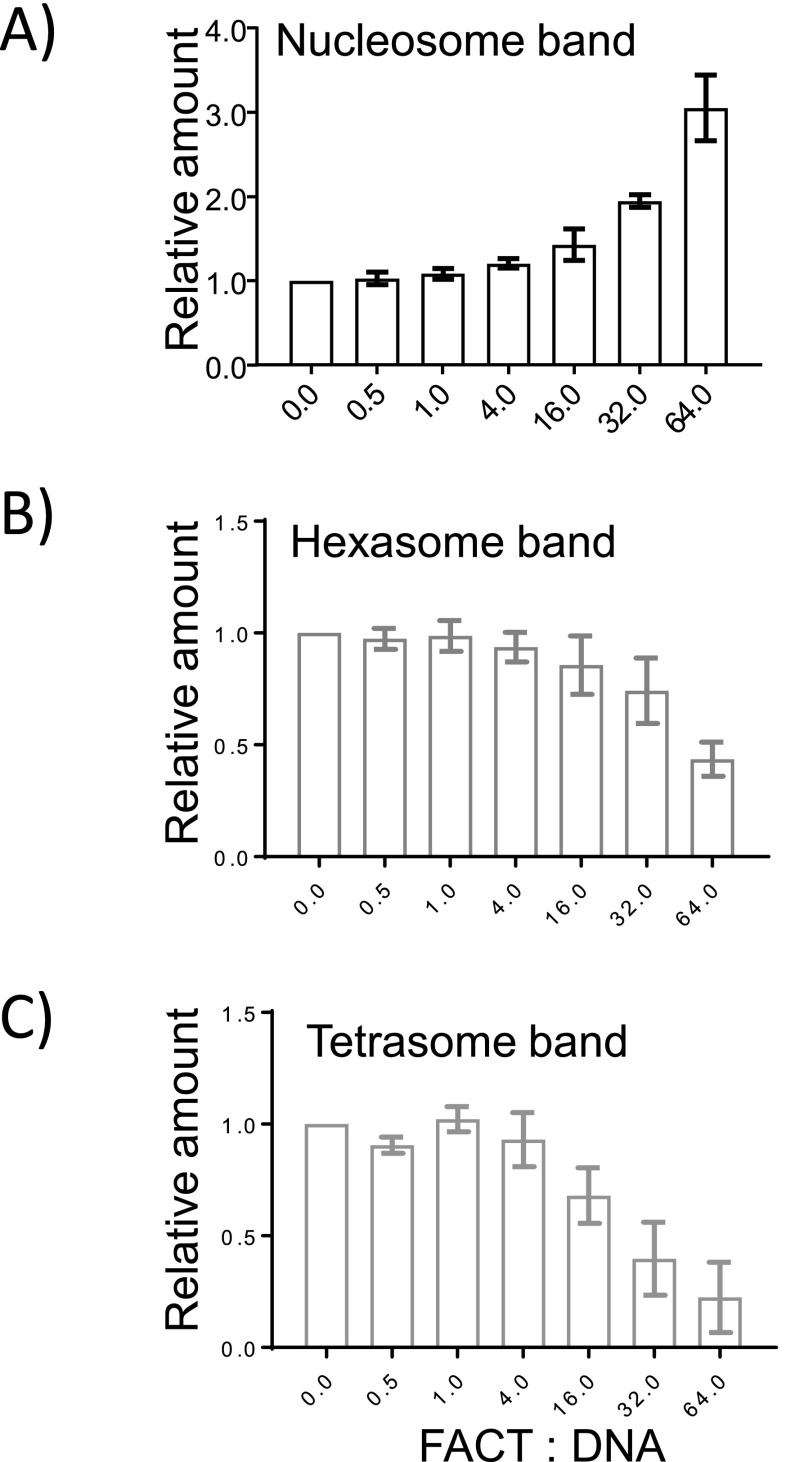
Figure S3. FACT facilitates the deposition of H2A–H2B onto a hexasome.
The gels shown in Fig 3C (and two others) were quantitated by ImageQuant (GE Healthcare Life Sciences). The fluorescence signals from nucleosomal H4 (A), hexasomal H2B (B), and tetrasomal H4 (C) were quantified. The intensity of controls (nucleosome, hexasome, or tetrasome; lane 3) was assumed as one, and the intensity ratio between samples with FACT and the control was determined. The error bars represent SD from three biological replicates.

