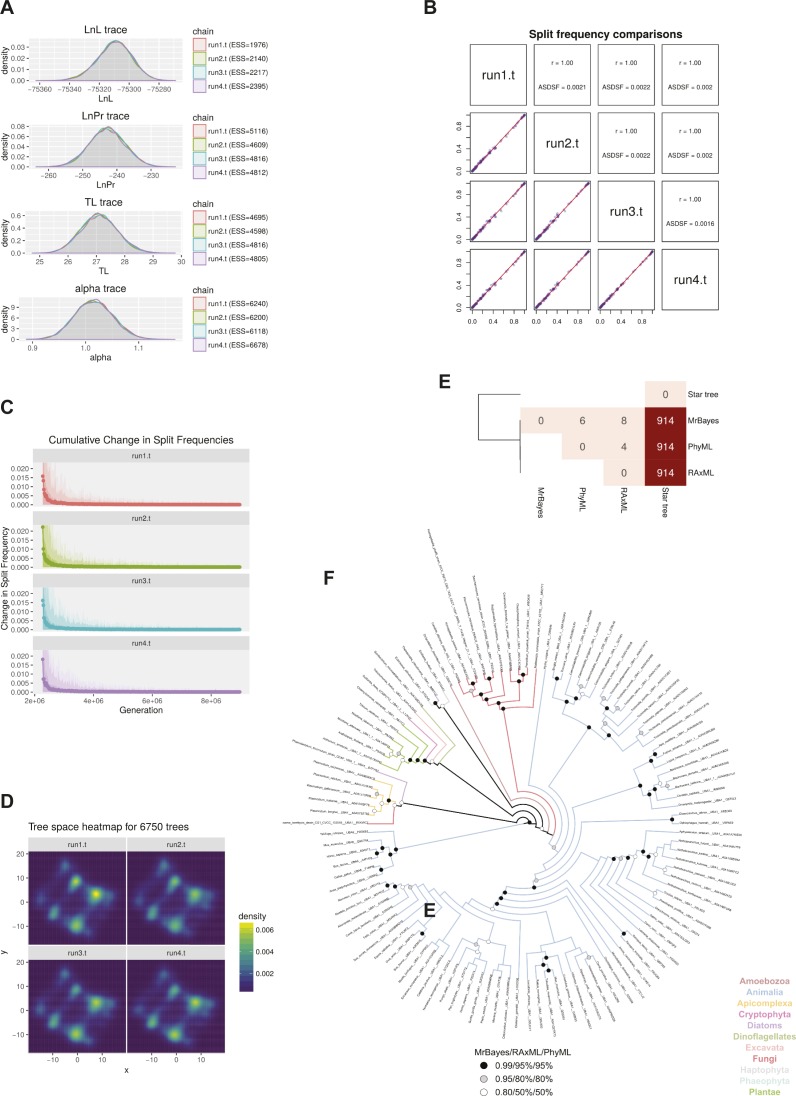
Figure S2.
Evolutionary analyses of UBA1 and UBA6 protein sequences. (A) Convergence of distributions of sampled parameter values of the evolutionary model across the four independent MrBayes runs. The effective sample size (ESS) value per parameter and run is in all cases much greater than the usually suggested minimum value of 200, indicating excellent parameter sampling. (B) Comparison of split frequencies among the four MrBayes runs. The Pearson's correlation coefficient values of 1 and the average standard deviations of split frequencies (ASDSF) that are well below 0.01 are evidence of sufficient topological convergence. (C) Evolution of cumulative average change in split frequencies during the course of each MrBayes run. Dots indicate the average change, whereas ribbons show the 100%, 95%, and 75% quantiles of the change in split frequencies. As each run independently converges on a solution, the change in split frequencies drops to nearly zero. (D) Two-dimensional projection of tree topologies explored by each MrBayes run. The high degree of similarity among plots constitutes another proof of topological convergence. (E) Heatmap of Matching Split distances (Bogdanowicz & Giaro, 2012a) among the three resulting trees and a non-phylogenetic star topology as a reference point. Overall, there are very few differences among the three trees, with the maximum likelihood ones being barely more similar to each other compared with the Bayesian tree. (F) Topological congruence among the trees produced by the three algorithms. The topology shown here is that of the MrBayes tree, as the Bayesian algorithm performed a more thorough exploration of parameter and tree space. Branches are coloured based on the taxonomic group that they belong to. Statistical support—in terms of posterior probabilities or bootstrap values—for each node across all trees is denoted with black, grey, or white circles. Nodes with black or grey circles are considered robust.

