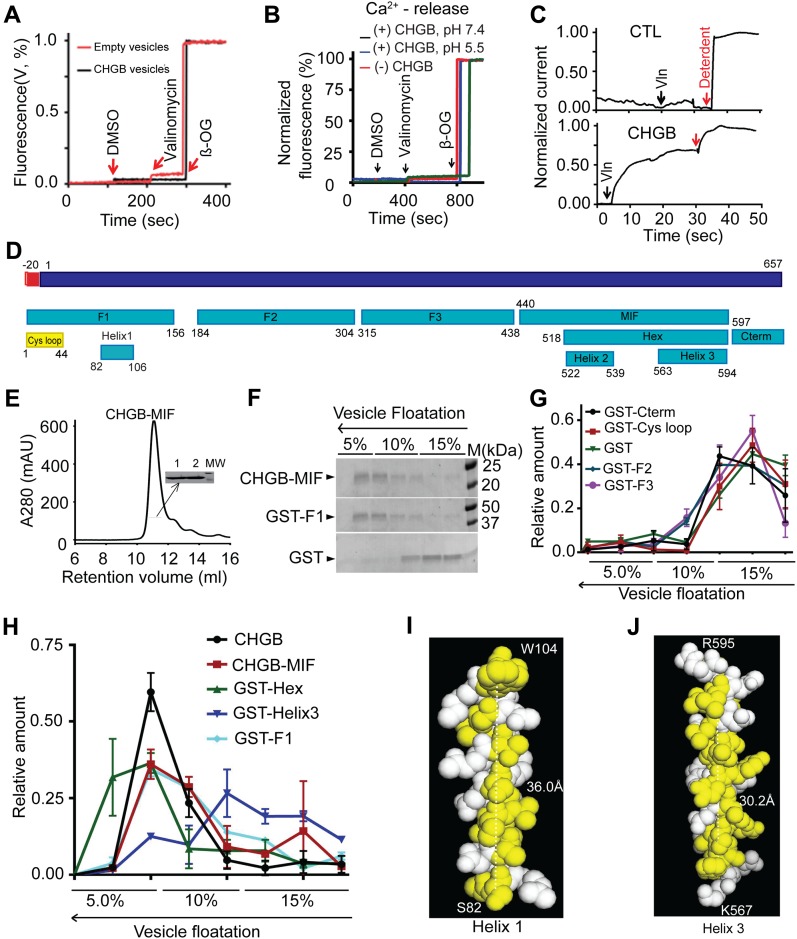
Figure 3. Mapping amphipathic helical segments for CHGB insertion in membrane.
(A) CHGB vesicles have no membrane cracks. CHGB vesicles loaded with 1.0 μM carboxy fluorescein were treated with 1.0 μl DMSO, 1.0 μM valinomycin, and finally with 5.0 mM β-OG to disrupt vesicles. (B) CHGB vesicles leak no Ca2+ at pH 7.4 or 5.5. Vesicles loaded with 1.0 mM CaCl2 were treated with 1.0 μl DMSO, 1.0 μM valinomycin, and finally with 5.0 mM β-OG. (C) Cl− release from vesicles recorded with a Ag/AgCl electrode. 300 mM KCl inside vesicles; 300 mM K-isethionate and 0.2 mM KCl, 10 mM Hepes pH 7.4 outside. 0.25 μM valinomycin started the release. At the end 10 mM β-OG was added to release all Cl−. A typical trace out of three (bottom) was shown. Control vesicles (top panel) did not show valinomycin-triggered response. The recordings were normalized to the β-OG signal. (D) A diagram of CHGB and different fragments. (E) SEC of CHGB-MIF in a Superdex 200 column. The inset is SDS–PAGE of two peak fractions. (F) Vesicle floatation assay for CHGB-MIF, GST-F1, and GST. (G, H) Distribution of CHGB and its fragments from vesicle floatation assays as in (F) and Fig S3E. Those staying at the bottom in (G) and those floating in (H). (I) A helical model for helix 1 with its hydrophobic residues in yellow. It was energetically optimized in Coot and presented in PyMol. (J) Structural model for helix 3.

