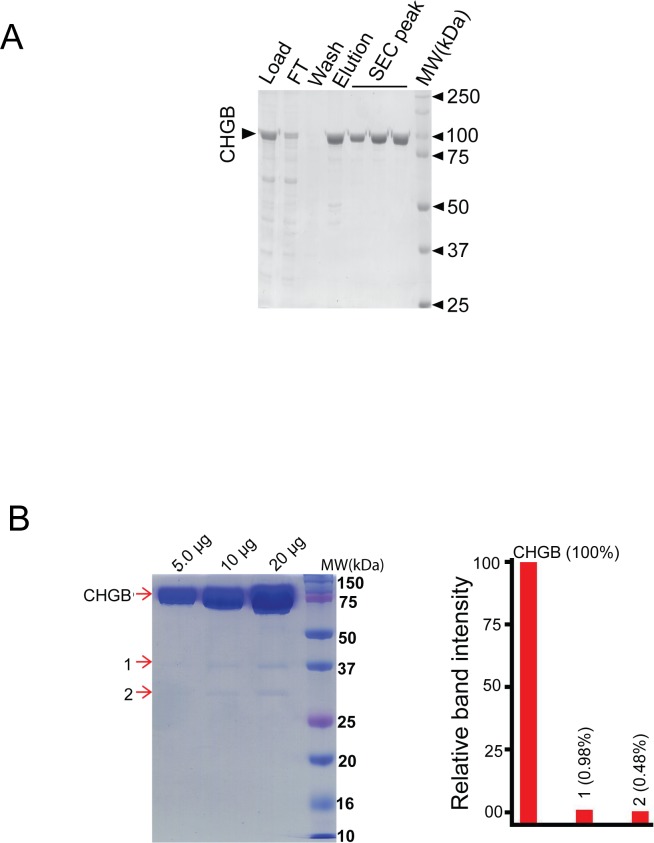
Figure S1. Purification of chromogranin B from over-expressing insect sf9 cells.
(A) CHGB protein over-expressed in insect cells was purified by ion exchange, affinity, and size-exclusion chromatography. The fractions were analyzed on SDS–PAGE gel. Load, FT, wash and elution represent the loading sample, the flow-through, washing, and eluted samples from the Ni-affinity column. The SEC peak was from a Superose 6 10/30 column. (B) Left: 5, 10, and 20 μg of purified recombinant CHGB were assayed in a Coomassie-blue–stained SDS–PAGE gel. The main CHGB band and the two contaminating bands (1 and 2) were cut out of the gels (at different times) and sent for mass spectrometry analysis and proteomic identification. The main band was analyzed by the core facility at UT Southwestern Medical Center and the two contaminating bands (1 and 2) were analyzed at UF ICBR. The identified protein candidates were listed in Table S1 for the main band and Table S2 for the two contaminating bands. Right, the scanned densities of these three bands were compared. The two contaminating bands account for only ∼1.4% of the density as the CHGB band, suggesting that the contaminants make a very small fraction of the total protein mass. From the data in table 3, the two contaminating bands are chiefly the partial degradation products of CHGB. These data together show that the amount of other proteins, if any, must be significantly less than 0.5% (the density of the contaminating band 2), and below 0.12%, which is the detection level in the gel. The purified CHGB is thus at least 99.8% pure with a small amount (<∼1.5%) of degradation. In most cases, the degradation bands in freshly purified CHGB were not detectable as shown in Fig 1B.

