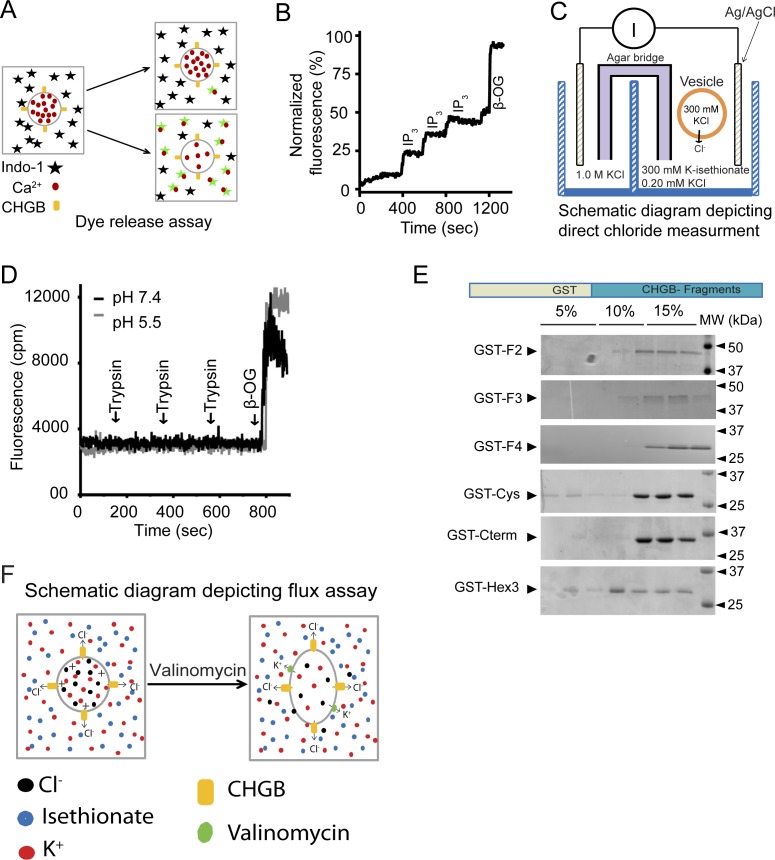
Figure S3. CHGB preferentially located to the outside of the vesicles and mapping its membrane interacting fragments.
(A) Schematic diagram of the Ca2+-release assay. 1.0 μM Indo-1 (black star) in the outside would fluoresce stronger when Ca2+ ions (red dots) are released from vesicles and bound to Indo-1 (green stars). Excitation: 340 nm. Emission: 410 nm. (B) Positive control for the Ca2+-release assay. Type 1 IP3R (a calcium release channel) protein was purified from rat cerebellum and reconstituted into egg PC vesicles with 1.0 mM CaCl2. The vesicles were changed into a Ca2+-free buffer before being used. The calcium release was induced by adding 1.0 μM IP3. β-OG was used to release all calcium at the end, and the data were normalized against the maximum signal. The experiments were repeated more than 4 times with similar results. (C). A diagram showing the direct measurement of chloride flux using an Ag/AgCl electrode. (D) Ca2+-loaded vesicles treated with trypsin while the fluorescence of Indo-1 was monitored as in (B). The experiments were performed at pH 7.4 (black) and 5.5 (grey). (E) Coomassie-blue–stained SDS–PAGE for the gradient fractions after the vesicle floatation experiments of different CHGB fragments as GST fusion proteins. (F) Schematic depiction of the light-scattering–based flux assay.

