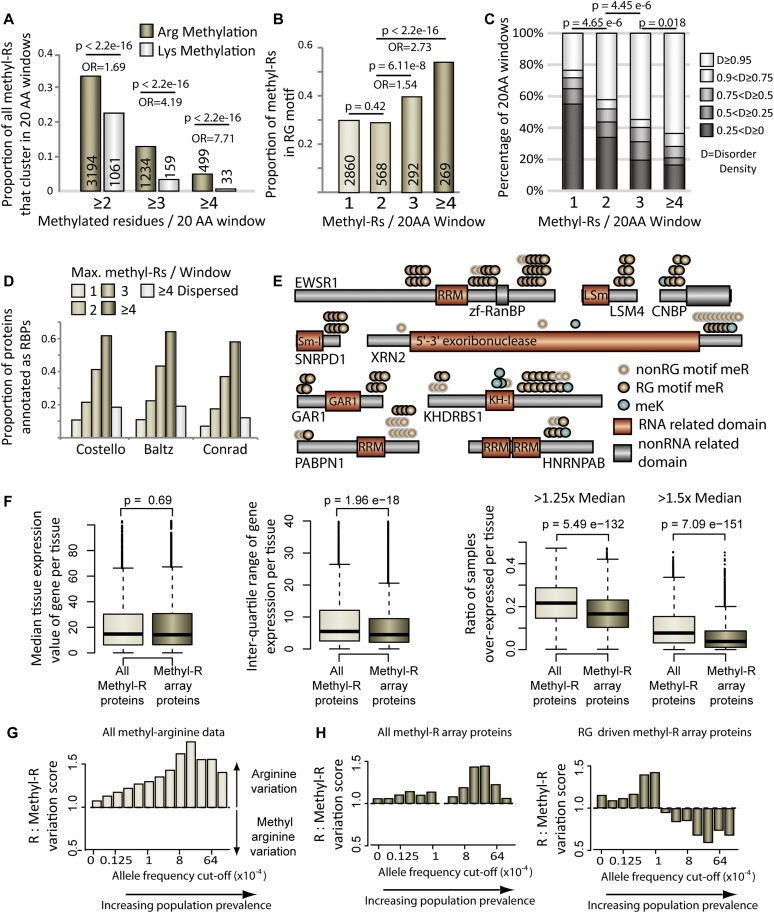
Figure 1. Methyl-arginine clusters show distinct sequence, expression and mutational signatures.
(A) Bar graph showing the proportional of methyl-arginine or methyl-lysine that clusters within 20–amino acid windows. (B) Proportion of methyl-arginines that are contained within an RG motif in each class of 20–amino acid window. P values and odds ratio (OR) for A and B calculated using Fisher’s exact test, numbers within the bars are the total methylation sites in each bar. (C) Bar graph showing the disorder distribution in 20–amino acid windows defined by the number of methyl-arginines they contain. P values calculated using two sided Mann–Whitney–Wilcoxon test. (D) Bar graph showing the ratio of each protein class that are annotated as RBPs in each of the three named studies. Dispersed methyl-arginine targets have ≥4 methylation sites but no clustering propensity. (E) Schematic diagrams of clustered methylation target proteins. (F) Median expression, inter-quartile range and overexpression analysis (left pair: 1.25× median cutoff; right pair: 1.5× median cutoff) of clustered methyl-arginine proteins and an equal-size randomly sampled comparison group from all other methylated proteins. P values calculated using two sided Mann–Whitney–Wilcoxon test. (G) Bar chart showing the ratio of arginines that have an annotated missense variant in comparison with the ratio of methyl-arginines that have an annotated missense variant at differing allele frequency cutoffs. (H) As in (G) but only using the arginines present in proteins targeted by clustered methyl-arginine windows (all data left, RG driven windows right).

