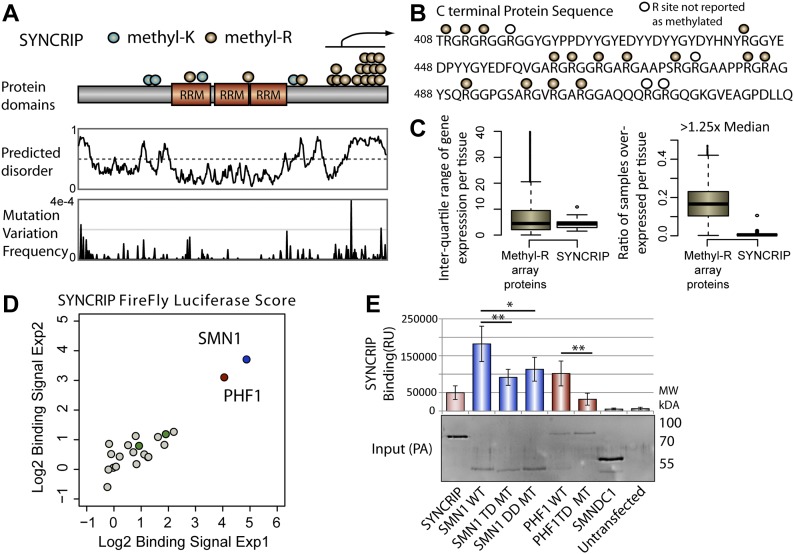
Figure 2. Identification of MeBPs that interact with SYNCRIP.
(A) Schematic representation of methylation sites annotated on the hnRNP SYNCRIP. Middle panel: predicted protein disorder of SYNCRIP. Lower panel: population max frequencies of genetic variation across SYNCRIP taken from the Gnomad dataset. For ease of representation, the y-axis is truncated to 4 × 10⁻⁴. (B) Amino acid sequence and arginine modifications in the C-terminal tail of SYNCRIP. (C) SYNCRIP GTEx expression data: inter-quartile range values (left panel) and overexpression ratios (right panel), for comparison with data obtained for all clustered methyl-R target proteins. (D) LUMIER experiments showing SMN1- and PHF1-binding signals separate from the majority distribution of other tested MeBPs. Green dots represent non-binding Tudor domain–containing MeBPs (SMNDC1 and PHF19). (E) LUMIER experiment testing SMN1 and PHF1 mutants against WT SYNCRIP. Input Western blot to show expression of protein A tagged constructs. Error bars represent highest and lowest observed values, two sided Mann–Whitney–Wilcoxon test used to determine statistical significance. *P < 0.05, **P < 0.01. TD, Tudor domain; DD, dimerization domain.

