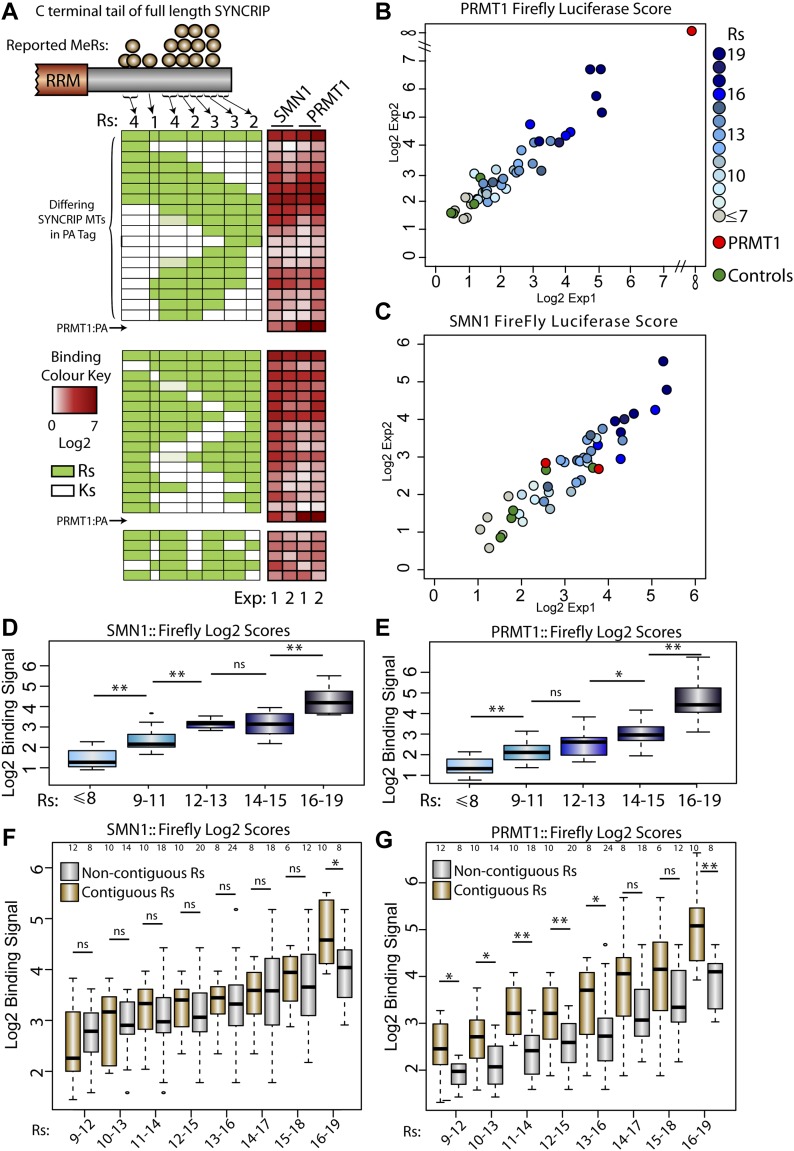
Figure 4. Systematic dissection of arginine requirement for PRTM1 and SMN1 binding to SYNCRIP.
(A) Schematic diagram representing the R to K full-length mutant constructs and their binding signal in each experiment (white-red heatmap next to schematics). Light green boxes represent R patches where only three of the four arginines were mutated to lysines post-sequence verification. PRMT1 (B) or SMN1 (C) binding signals in medium throughput LUMIER experiment assaying multiple R to K mutations on the binding of full-length SYNCRIP. SMN1- (D) or PRMT1- (E) binding signal box plots for each group of R to K SYNCRIP mutants. Groups designated by the total number of remaining C-terminal arginines. SMN1- (F) or PRMT1- (G) binding signal box plots for subgroups of R to K SYNCRIP mutants. Each subgroup designated by the total number of arginines in either a contiguous or noncontiguous sequence. Numbers at the top of each blot represent the number of data points in each box plot. One sided Mann–Whitney–Wilcoxon test used to determine statistical significance. *P < 0.05, **P < 0.01.

