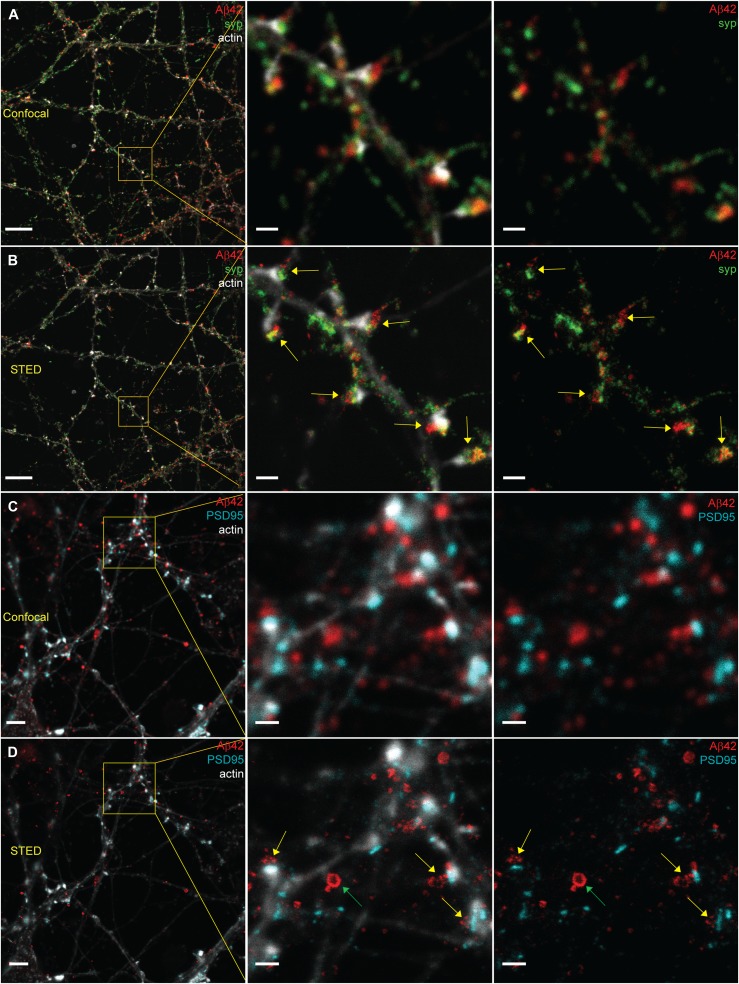
Figure 1. Comparison of confocal and STED images for studying the synaptic localization of Aβ42 in hippocampal neurons.
(A, B) Hippocampal neurons stained to visualize Aβ42 (red), synaptophysin (green), and actin (light grey) were imaged by confocal microscopy (A) and STED microscopy (B). Yellow arrows point at enrichment of Aβ42 at the synapse. Left scale bars: 10 μm. Other scale bars: 1 μm. (C, D) Hippocampal neurons subjected to immunocytochemistry to visualize Aβ42 (red), PSD95 (cyan), and actin (light grey) were imaged by confocal microscopy (C) and STED microscopy (D). Yellow arrows point at enrichment of Aβ42 at the synapse. Green arrow points at an Aβ42-stained vesicle where Aβ42 is stained only at the rim of the vesicle. Left scale bars: 4 μm. Other scale bars: 1 μm.

